SMS vs. email marketing in 2026: what the metrics actually say about each channel
SMS wins every engagement metric — 90-98% open rates, 6-35% CTR — but email's unsubscribe rates are 10-15x lower and its ROI is more predictable. This post compares the two channels head-to-head on every retention metric, covers what subscribers actually tolerate from each, and lays out when to use SMS, when to use email, and why brands running both see 30% higher customer lifetime value.
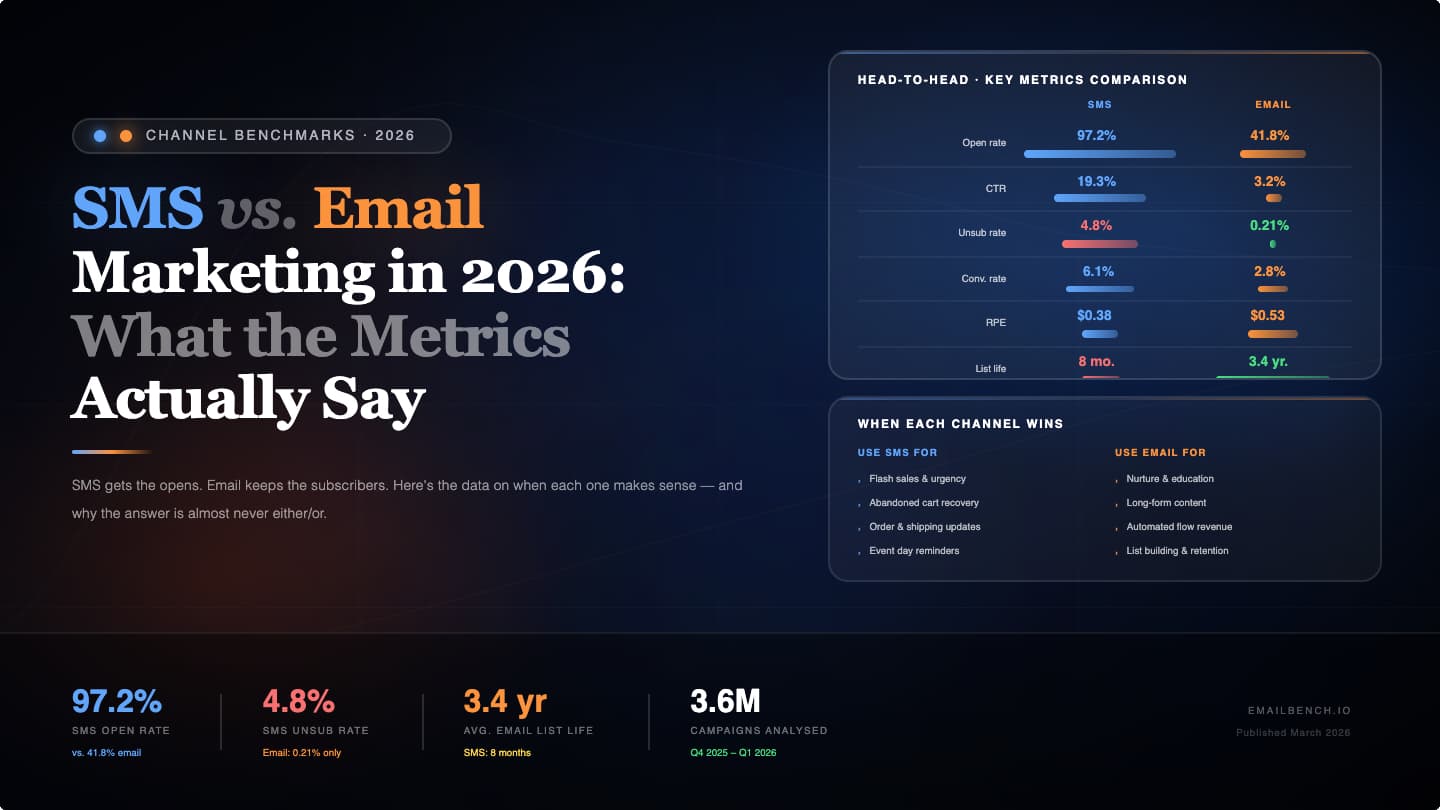
SMS gets the opens. Email keeps the subscribers. Here's the data on when each one makes sense.
Part 7 of 11 in the 2026 Email Marketing Benchmarks. Previous: Automation ← | Next: AI Email Marketing
Key takeaways
- SMS open rates (90-98%) dwarf email (28-39%), but email unsubscribe rates are 10-15x lower
- Email ROI ($36-$42 per $1) is more consistent than SMS ($21-71 per $1)
- SMS CTR reaches 6-35% vs. email's 2-3.8%, but subscribers are far less tolerant of frequency
- 84% of consumers have opted into business SMS; 53% unsubscribe if over-messaged
- Brands using both channels see 30% higher customer lifetime value
The SMS vs. email debate usually gets framed as a competition, which is the wrong way to think about it. They have completely different engagement profiles and completely different failure modes.
SMS open rates hit 90-98%. Click-through rates range from 6-35%. Those numbers make email look bad on paper. But email unsubscribe rates are 10-15x lower, subscribers tolerate daily emails while revolting against daily texts, and email ROI is narrower and more predictable. SMS has a higher ceiling and a lower floor.
So the useful question is when each one earns its place.
This post is part of our 2026 Email Marketing Benchmarks series.
The head-to-head comparison
Core metrics
| Metric | SMS | Winner | |
|---|---|---|---|
| Open rate | 90-98% | 28-39% | SMS |
| Click-through rate | 6-35% | 2-3.8% | SMS |
| Conversion rate | 21-30% | 12-15% | SMS |
| Response rate | 45% | ~6% | SMS |
| Time to read | 90% within 3 min | 90 min avg | SMS |
| ROI | $21-71 per $1 | $36-42 per $1 | Email (consistency) |
| Unsubscribe rate | 1.5-3.5% | 0.08-0.22% | |
| Frequency tolerance | 1/week | Daily acceptable | |
| Content depth | 160 chars | Unlimited | |
| Relationship building | Limited | Strong |
SMS wins every engagement metric. Not close. But email wins the metrics that determine whether you still have a list six months from now. Unsubscribe rates are 10-15x lower. That gap matters more than most people appreciate when planning long-term retention.
What subscribers actually tolerate
SMS tolerance
| Behavior | Percentage |
|---|---|
| Consumers opted into business SMS | 84% (up 6% YoY) |
| Purchased after receiving brand texts | 75% |
| Bought sooner due to timely SMS | 65% |
| Comfortable with 1 text/week | 49% |
| Unsubscribe if over-messaged | 53% |
Email tolerance
| Behavior | Percentage |
|---|---|
| Consumers who enjoy brand emails | 76% |
| Want promotional offers via email | 60% |
| Adults citing email as preferred format for offers | 59% |
| Unsubscribe weekly from brand emails | 40% |
| Primary reason for unsubscribing | Excessive messaging (60%) |
This is the part that should give SMS-heavy teams pause. Nearly half of consumers are only comfortable with one text per week, and 53% will leave if they feel over-messaged. Email subscribers tolerate far higher frequency. Daily sends are common and accepted across many industries.
You can push email harder before people push back.
ROI: consistent vs. variable returns
Email ROI
| Segment | ROI |
|---|---|
| Industry average | $36-$42 per $1 |
| Retail/ecommerce | Up to $45 per $1 |
| US merchants (Omnisend) | $76 per $1 |
| Automated flows | 30x higher than campaigns |
Email ROI is well-documented across millions of senders and decades of data. The range is relatively tight.
SMS ROI
| Segment | ROI |
|---|---|
| Conservative estimates | $21-$41 per $1 |
| High estimates | Up to $71 per $1 |
| Americas region CTR | 22.2% (9x email) |
SMS ROI varies enormously depending on implementation quality, audience composition, and message strategy. The ceiling is higher than email. The floor is lower. And the outcome is harder to predict going in.
Market growth
The US SMS marketing market is growing from $2.9B (2023) to a projected $9.96B (2030) at 20.3% CAGR. 66% of businesses now use SMS marketing software, and 67% plan to increase budgets.
When to use which channel
Use SMS for:
| Use case | Why |
|---|---|
| Flash sales (2-4 hour windows) | 90% read within 3 minutes |
| Shipping/delivery updates | Real-time, high-expectation moments |
| Back-in-stock alerts | Urgency plus scarcity |
| [Abandoned cart (first touch) | F](https://www.geysera.com/blog/abandoned-cart-email/abandoned-cart-email-the-ultimate-guide-to-recovering-lost-revenue-in-2026)astestastest) recovery mechanism |
| Appointment reminders | Near-100% visibility |
| Limited inventory alerts | Time-sensitive by nature |
Use email for:
| Use case | Why |
|---|---|
| Welcome series | Depth, design, progressive narrative |
| Product launches | Space for imagery, copy, multiple CTAs |
| Newsletter/content | Unlimited content depth |
| Post-purchase nurture | Relationship building over time |
| Win-back sequences | Multi-touch, higher tolerance for attempts |
| Promotional campaigns | Higher frequency tolerance, lower unsub risk |
Use both for:
| Use case | Strategy |
|---|---|
| Abandoned cart recovery | SMS at 30 min, email at 1 hour, email at 24 hours |
| Product launches | Email for announcement + detail; SMS for "goes live now" |
| VIP/loyalty moments | Email for the value story; SMS for the exclusive access code |
| Seasonal sales | Email for the catalog; SMS for the time-limited deal |
The combined channel effect
Jimmy Kim (CEO of Sendlane) built his platform around the idea that email and SMS are complementary retention tools. SMS handles the urgent, time-sensitive triggers. Email handles relationship-building, education, and longer purchase journeys. They're different jobs.
Nikita Vakhrushev (founder of Aspekt Agency, who writes the "Retention Secrets" newsletter) pivoted his entire agency to focus on email plus SMS retention. His data show that brands using both channels see a 30% higher customer lifetime value than those using either channel alone.
The CLV impact
| Strategy | CLV comparison |
|---|---|
| Email only | Baseline |
| SMS only | Slightly lower (lacks relationship depth) |
| Email + SMS combined | +30% higher CLV |
The combined approach works because email is good at the thing SMS is bad at (depth, frequency, relationship-building) and SMS is good at the thing email is bad at (immediacy, urgency, guaranteed visibility). Subscribers active on both channels buy more often and spend more per order.
Channel-specific metrics to track
SMS targets
| Metric | Target |
|---|---|
| Delivery rate | >95% |
| Click-through rate | >10% |
| Conversion rate | >15% |
| Opt-out rate | <3% per campaign |
| Revenue per message | Track by flow type |
| List growth rate | 5-10%/month |
Email targets
| Metric | Target |
|---|---|
| Inbox placement | >85% |
| CTR (campaigns) | >2% |
| CTR (flows) | >5% |
| RPR (flows) | >$1.94 |
| Unsubscribe rate | <0.5% |
| List growth rate | 1-3%/month |
For the complete email metrics framework: The email metrics that actually matter in 2026
Common mistakes with SMS + email
Treating SMS like a short email. SMS requires different copywriting. 160 characters. No greetings, no intros, no sign-offs. Get to the point.
Over-messaging on SMS. One to two texts per week maximum for most audiences. Go over that, and 53% will unsubscribe. Transactional messages (shipping, delivery) are a different story.
Sending the same message on both channels at the same time. Subscribers who get identical messages on SMS and email feel spammed. Differentiate the message, or at least the timing.
Not coordinating suppression. If someone buys after getting the SMS, suppress the follow-up email. Sounds obvious. Most setups don't do this, and the people who already bought get the "did you forget something?" message anyway.
Ignoring cross-channel attribution. Without unified tracking, both SMS and email claim credit for the same purchase. Your revenue reports add up to more than what actually happened.
Related: Email attribution is broken
Frequently asked questions
Is SMS or email better for marketing ROI?
Email is more consistent at $36-$42 per dollar. SMS ranges widely ($21-$71) depending on execution. The best results come from using both — CLV increases 30% compared to either channel alone.
What is the average SMS click-through rate?
6-35% depending on industry, with the Americas averaging 22.2%. That's 3-10x higher than email's 2-3.8%. The gap is real, but SMS also burns through subscriber patience much faster.
How often should I text my subscribers?
49% are comfortable with one text per week. 53% will unsubscribe if they feel over-messaged. Start at one to two per week and watch opt-out rates. Transactional messages can run higher.
Should I use SMS or email for abandoned cart recovery?
Both. SMS at 30 minutes for the immediate nudge, then email at 1 hour and 24 hours with more detail, product images, and social proof. You're catching impulse buyers with SMS and deliberate buyers with email.
How does combining SMS and email affect customer lifetime value?
About 30% higher CLV compared to using either channel alone. Email builds the relationship over time, and SMS captures time-sensitive moments. Subscribers engaged on both channels buy more frequently.
Related reading:
Sources
- Omnisend SMS Marketing Statistics 2026
- DigitalMindsBPO SMS vs Email Statistics 2026
- Sakari SMS Marketing Statistics 2025-2026
- DotDigital Marketing Benchmarks Americas Edition
- Project Broadcast SMS Marketing Statistics 2026
- Jimmy Kim, sendlane.com
- Nikita Vakhrushev, aspektagency.com
2026 Email Marketing Benchmarks — Full Series
- The Email Metrics Framework Nobody Uses (But Should)
- Open Rates Are Lying to You
- Click-Through Rates: The Metric That Actually Matters
- Revenue Per Recipient: The Only Email Metric Your CFO Cares About
- Email Deliverability: The Numbers Behind Whether Your Emails Actually Arrive
- Automation vs. Campaigns: The Data Behind the 17x Revenue Gap
- SMS vs. Email Marketing: What the Metrics Actually Say (you are here)
- Email Attribution Is Broken
- AI Email Marketing in 2026
- The email metrics that actually matter in 2026
- 2026 Email Marketing Benchmarks by Industry: The Complete Reference

Co-Founder and CEO
Bob Thordarson is CEO and Co-Founder of Geysera, a serial entrepreneur with 25+ years and five co-founded ventures, including Cequint (acquired by TNS in 2010 for $112.5M) and Consumerware (acquired by ParkerVision). A graduate of the University of Washington and MIT Entrepreneurial Masters Program, based in Seattle, he serves on the boards of DRY Soda Co. and the Entrepreneurs' Organization Seattle chapter. He is an expert in retention marketing email systems and methodology for ecommerce and B2B brands — measured by incremental revenue, not vanity metrics.