Email deliverability in 2026: the numbers behind whether your emails actually arrive
Email deliverability benchmarks for 2026 — global inbox placement 87.2% (Validity 2026), Gmail 89.8%, Yahoo 87.3%, Microsoft 77.4%, Apple Mail 82%. Apple MPP impact, industry gaps, B2B filtering challenges, BIMI adoption, and Jennings' ratio metrics.
Published: March 15, 2026 · Last updated: May 11, 2026
Email deliverability is the ability for a sent email to reach the recipient's primary inbox rather than spam, junk, or a filtered tab — measured as the percentage of sent emails that achieve inbox placement. It differs from email delivery rate, which only measures whether the receiving mail server accepted the message. The 2026 global average is 87.2% inbox placement (Validity 2026, covering 2025 data), with Gmail at 89.8%, Yahoo at 87.3%, Microsoft (Outlook/Hotmail) at 77.4%, and Apple Mail at 82% — top performers reach 95%+, while roughly 1 in 8 marketing emails still never reach the inbox.
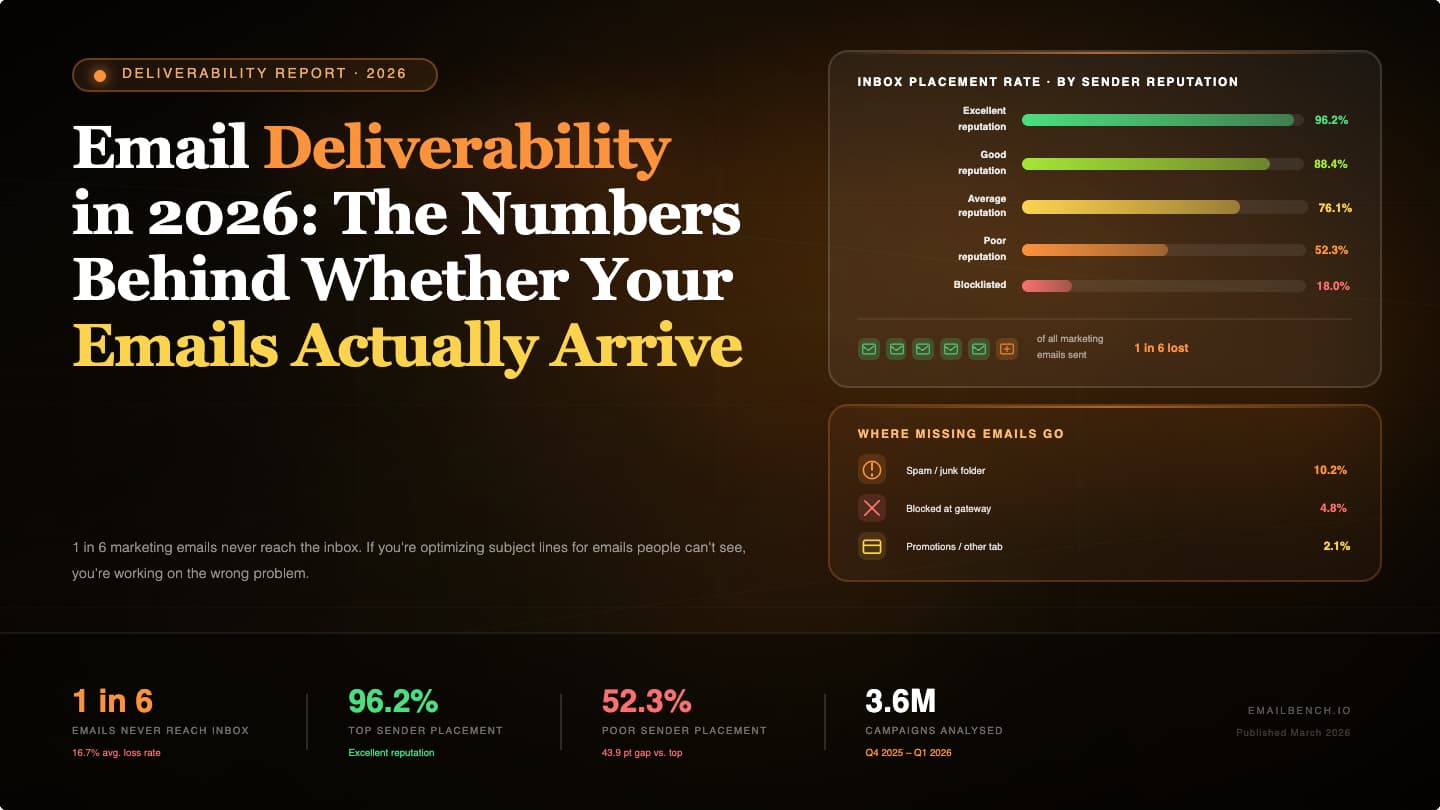
If you're optimizing subject lines for emails people can't see, you're working on the wrong problem.
KEY STATS
- Global inbox placement reached 87.2% in 2025 — a 3.7-percentage-point uplift year over year, the largest single-year improvement Validity has recorded (Validity 2026 Email Deliverability Benchmark Report).
- Provider-level IPR all moved up: Gmail 89.8% (+2.6pp), Yahoo 87.3% (+1.3pp), Microsoft (Outlook/Hotmail) 77.4% (+1.8pp), Apple Mail 82% (+5.7pp) — Validity 2026.
- Industry inbox placement ranges from 80.1% (Real Estate) to 97.2% (Transportation), with Software / B2B SaaS at 85.7% — still 1.5 percentage points below the 87.2% global average (Validity 2026).
- B2B got harder: hosting platforms (Office 365 + Google Apps) dropped to 83.0% (-1.3pp) and corporate filtering companies (Proofpoint et al) dropped to 79.0% (-5.8pp) — the worst-performing B2B subsegment in the Validity 2026 cohort.
- Real Estate inbox placement continued to slide: 80.1% in 2025, down from 83.3% the prior year — the bottom-ranked industry sector in the Validity 2026 benchmark.
- Only 18.2% of the top 10 million domains have valid DMARC records; only 7.6% enforce DMARC policies (Validity).
- Spam complaint threshold: 0.3% triggers throttling; target below 0.10% (Google Postmaster Tools enforcement).
- In the US and Canada, more than 20% of commercial emails do not reach subscribers' inboxes — billions of dollars in lost revenue annually (PowerDMARC 2026).
- Data sourced from Validity (2026 Email Deliverability Benchmark Report — covering 2025 data), Mailchimp (2026 benchmarks), MailerLite (2025-2026), Mailforge.ai, and Google Postmaster Tools.
TL;DR Email deliverability measures whether sent emails reach the primary inbox rather than spam, junk, or a filtered tab. The 2026 global average is 87.2% inbox placement per Validity 2026 (Gmail 89.8%, Yahoo 87.3%, Microsoft 77.4%, Apple Mail 82%) — up 3.7pp year over year as bulk-sender requirements paid off. The biggest deliverability levers in 2026 are: full SPF/DKIM/DMARC authentication with
p=rejectenforcement, one-click unsubscribe (RFC 8058 List-Unsubscribe-Post header), engagement-driven sender reputation, spam complaint rate below 0.10%, and list hygiene. B2B senders face a tougher landscape than consumer-facing brands — filtering companies dropped 5.8pp in 2025. Apple Mail Privacy Protection inflates open rates 15-20pp, making CTR and RPR more reliable engagement-quality proxies.
What's in this guide:
- What is email deliverability?
- What's the difference between email delivery and email deliverability?
- How many emails actually reach the inbox?
- Inbox placement by mailbox provider (Gmail / Yahoo / Outlook)
- Inbox placement by industry (2025 data)
- B2B-specific deliverability: hosting platforms and corporate filters
- Gmail's September 2025 relevance update
- Apple Mail Privacy Protection (MPP) and what it changed for deliverability
- Gmail proxy and image-loading: the engagement-signal problem
- Authentication requirements: what's now mandatory
- BIMI: brand logos in the inbox
- Microsoft and Outlook bulk-sender requirements
- Bounce rate benchmarks
- Unsubscribe rate benchmarks
- Jennings' ratio metrics
- The spam complaint threshold
- Deliverability scoring tools and what each one tells you
- Mobile and deliverability
- How to improve email deliverability
- Frequently Asked Questions
What is email deliverability?
Email deliverability is the ability for a sent email to reach the recipient's primary inbox rather than spam, junk, or a filtered tab. It's measured as the percentage of emails that achieve inbox placement out of those sent. Per the Validity 2026 Email Deliverability Benchmark Report (covering 2025 data), the global average is 87.2% inbox placement, with Gmail at 89.8%, Yahoo at 87.3%, Microsoft (Outlook/Hotmail) at 77.4%, and Apple Mail at 82% — top performers reach 95%+. Deliverability is shaped by sender reputation, authentication (SPF/DKIM/DMARC), engagement signals, list hygiene, and content quality.
What's the difference between email delivery and email deliverability?
Email delivery measures whether the receiving mail server accepted the message (the 2026 industry average is 98.16%). Email deliverability measures whether the message reached the primary inbox (87.2% global average per Validity 2026). The gap between these two numbers — roughly 11 percentage points — represents emails that were delivered but routed to spam, junk, or a filtered tab. Delivery asks "was the email accepted?" Deliverability asks "did the recipient have a fair chance to see it?"
How many emails actually reach the inbox?
2026 deliverability benchmarks (covering 2025 data)
| Metric | Benchmark |
|---|---|
| Email delivery rate (accepted by server) | 98.16% |
| Global average inbox placement (reaches inbox, not spam) | 87.2% (+3.7pp YoY) |
| Spam placement rate (delivered to spam folder) | 6.1% |
| Missing rate (blocked, rejected, or lost) | 6.6% |
| Best case (full auth + aged domain + strong engagement) | 95%+ |
Delivery rate and inbox placement are not the same thing, and confusing them is one of the most common mistakes in email marketing reporting. A 98% delivery rate means the server accepted the email — it may have routed it straight to spam. Per Validity's 2026 Email Deliverability Benchmark Report, the global inbox placement rate climbed to 87.2% in 2025 — a 3.7-percentage-point uplift year over year, driven primarily by reduced "missing" rates as Gmail, Yahoo, and Microsoft's bulk-sender requirements took hold. Roughly 1 in 8 marketing emails still misses the inbox, but the gap is closing — not widening.
For Gmail — the world's largest mailbox provider at 42.9% of global market share — inbox placement reached 89.8% in 2025, up 2.6pp year over year. Microsoft (Outlook/Hotmail), historically the toughest mailbox for marketers, lagged at 77.4% but is trending up.
What this looks like for a real list
If you email 100,000 subscribers (using 2025 global averages from Validity 2026):
- ~98,000 are "delivered" (accepted by mail servers)
- ~87,200 reach the inbox at the global IPR average
- ~6,100 land in spam
- ~6,600 are missing — blocked, rejected, or otherwise lost
- ~12,800 people on your list never reach the inbox at all
No subject line test, send-time optimization, or design change fixes invisible emails. The 87.2% inbox-placement ceiling is your real audience size, not your list size.
Inbox placement by mailbox provider (Gmail / Yahoo / Microsoft / Apple)
Inbox placement varies sharply by mailbox provider. The single biggest factor is each provider's filtering aggression and how strictly they enforce the bulk-sender requirements that Gmail, Yahoo, and Microsoft rolled out between February 2024 and May 2025. Per the Validity 2026 Email Deliverability Benchmark Report, every major consumer provider improved year over year — but the gap between the leader (Gmail) and the laggard (Microsoft) is still over 12 percentage points.
| Provider | 2025 IPR | YoY change | Notes |
|---|---|---|---|
| Gmail | 89.8% | +2.6pp | The world's largest mailbox provider (42.9% global share). Inbox improvements followed launch of stricter bulk-sender enforcement in November 2025. |
| Yahoo Mail | 87.3% | +1.3pp | Stable since the February 2024 bulk-sender enforcement; a short-term dip is expected in 2026 as AT&T and Comcast accounts migrate into Yahoo. |
| Apple Mail | 82.0% | +5.7pp | The biggest year-over-year uplift of any major provider, benefiting from a "halo effect" as senders upgraded to comply with Gmail/Yahoo/Microsoft requirements. |
| Microsoft (Outlook/Hotmail) | 77.4% | +1.8pp | Historically the toughest MAGY provider. Microsoft's May 2025 bulk-sender enforcement explains the Q1-Q2 upswing; further gains expected through 2026. |
| Corporate / enterprise (Microsoft 365, Workspace) | 79-83% | -1.3 to -5.8pp | B2B-specific. Hosting platforms (Office 365 + Google Apps) at 83.0%; corporate filtering companies (Proofpoint et al) at 79.0% — the only segment that declined in 2025 (see B2B section below). |
Provider-level inbox placement in 2025 ranges from 77.4% at Microsoft to 89.8% at Gmail — a 12.4-percentage-point spread, per Validity's 2026 Email Deliverability Benchmark Report. Apple Mail posted the biggest year-over-year gain at +5.7pp, while Gmail consolidated its lead at the top. The standout exception is B2B: hosting platforms and corporate filters were the only mailbox segments to decline year over year — filtering companies dropped 5.8pp to 79.0%, making B2B the hardest deliverability environment of 2025.
Data sourced from Validity 2026 Email Deliverability Benchmark Report and Mailforge.ai 2026 domain deliverability benchmarks.
Inbox placement by industry (2025 data)
Inbox placement varies meaningfully by industry — driven by audience engagement quality, list acquisition method, send-volume patterns, and how aggressively corporate vs. consumer mailbox filters treat each vertical's content. Per Validity's 2026 Email Deliverability Benchmark Report (covering 2025 data), the global average across all industries is 87.2%, up 3.7 percentage points year over year.
Here are the 2025 results across all major industry sectors Validity tracks, with the global average shown for reference:
| Industry sector | 2025 inbox placement |
|---|---|
| Transportation | 97.2% (top performer) |
| Energy, Utilities & Waste | 95.0% |
| Telecommunications | 92.6% |
| Government | 91.4% |
| Travel & Hospitality | 90.8% |
| Insurance | 90.4% |
| Retail | 90.4% |
| Holding Companies & Conglomerates | 90.2% |
| Manufacturing | 89.9% |
| Finance | 88.8% |
| Hospitals & Physicians Clinics | 88.4% |
| Media & Internet | 88.1% |
| Organizations | 87.7% |
| Education | 87.6% |
| Global average | 87.2% |
| Construction | 86.5% |
| Software / B2B SaaS | 85.7% (below average by 1.5pp) |
| Business Services | 85.1% |
| Law Firms & Legal Services | 82.1% |
| Consumer Services | 81.2% |
| Healthcare Services | 80.3% |
| Real Estate | 80.1% (bottom of table) |
Per Validity's 2026 Email Deliverability Benchmark Report, industry inbox placement in 2025 ranges from 80.1% (Real Estate) to 97.2% (Transportation) — a 17.1-percentage-point spread. Software / B2B SaaS sits at 85.7%, still 1.5 points below the 87.2% global average. Transportation, Business Services, and Energy/Utilities/Waste posted the biggest year-over-year gains (+8.4pp, +8.4pp, +8.2pp respectively), while Construction, Law Firms & Legal Services, and Government posted the largest declines.
A few patterns worth calling out:
- B2B SaaS improved, but still trails. Software / B2B SaaS climbed to 85.7% — a meaningful improvement from prior cycles — but the sector still sits below the 87.2% global average. Corporate-side filters and cold-outreach infrastructure remain the biggest drags on B2B deliverability.
- Real Estate continued to slide. Now at 80.1% — the bottom of Validity's 2026 table. Real Estate has struggled for several years with economic pressures and high Gmail spam rates (20.7%) and Microsoft missing rates (22.4%). Programs with long periods between transactions struggle to generate the engagement signals mailbox providers reward.
- Retail and Finance jumped. Retail at 90.4% and Finance at 88.8% — both well above average. The Finance + Insurance sector benefited disproportionately from authentication discipline as consumers became more confident the legitimate messages they received weren't phishing attempts.
- The bottom three are all services categories. Real Estate (80.1%), Healthcare Services (80.3%), and Consumer Services (81.2%). The common thread: high spam rates (10-16%) driven by low engagement and aggressive list acquisition.
B2B-specific deliverability: hosting platforms and corporate filters
If you're sending to business addresses, the consumer-mailbox numbers above don't tell your story. Per Validity's 2026 Email Deliverability Benchmark Report, B2B was the only segment where deliverability declined in 2025 — and the decline was significant.
| B2B segment | 2025 IPR | YoY change |
|---|---|---|
| Hosting platforms (Office 365, Google Apps) | 83.0% | -1.3pp |
| Corporate filtering companies (Proofpoint, Mimecast, Cisco) | 79.0% | -5.8pp |
Per Validity 2026, B2B was the only mailbox segment where inbox placement declined year over year in 2025. Hosting platforms (Office 365 + Google Apps, together 95%+ of B2B hosting market) dropped 1.3pp to 83.0%, while corporate filtering companies (Proofpoint alone holds 50% of the corporate filtering market) dropped 5.8pp to 79.0%. Most B2B recipients face a "double whammy" — both a hosting platform filter and a corporate filter applied to every inbound message.
Why B2B is structurally harder
- Two filters, not one. Most B2B recipients sit behind a hosting platform and a corporate filter. Each filter applies its own rules. Pass one, fail the other, and the message is gone.
- Admin-set custom controls. Corporate filter admins can define unique allow/block lists, inbound gateway rules, spoofing-protection rules (often enhanced DMARC policies), and custom spam thresholds. None of this is visible from the sender side.
- Authentication breaks during forwarding. B2B messages often pass through intermediate servers (auto-forwarders, security appliances). SPF and DKIM checks break when the forwarding IP doesn't match the original. Without Authenticated Received Chain (ARC, RFC 8617), your authentication results are lost at every hop.
- Sender reputation is more brittle. Corporate filters weight reputation more heavily than consumer filters. A single complaint cluster from one Proofpoint-protected enterprise can suppress your placement across hundreds of customer accounts.
Three moves that matter most for B2B senders
- Implement ARC. Authenticated Received Chain preserves SPF/DKIM/DMARC results across intermediate forwarders. Without it, every forwarded B2B message effectively loses authentication. Most major ESPs support ARC — verify it's enabled.
- Separate B2B cold outreach from product/marketing sends. B2B prospecting infrastructure is the single biggest deliverability liability for SaaS marketers. Keep cold outreach on a different sending domain (and IP) from your engaged-subscriber marketing program. Otherwise, cold-outreach complaints poison your product-email reputation.
- Get on Microsoft's SNDS (Smart Network Data Services). B2B audiences skew heavily Microsoft — Office 365 is 60% of B2B hosting market share. SNDS gives you the same kind of reputation visibility for Microsoft that Google Postmaster Tools gives you for Gmail. Most B2B senders skip it. Don't.
Source: Validity 2026 Email Deliverability Benchmark Report, B2B Senders section.
Gmail's September 2025 relevance update
What changed
Gmail now shows promotional emails in order of relevance, not recency. Users can still switch to "Most Recent," but the default view prioritizes brands the subscriber regularly engages with, recent interaction history, sender reputation scores, and authentication compliance.
What this means for senders
If your engagement is low, you get buried in the Promotions tab regardless of when you send. A perfectly crafted email sent at "optimal time" will sit beneath messages from brands the subscriber actually opens.
That said, the Promotions tab isn't the graveyard marketers feared. ZeroBounce 2025 found 54% of users check the Promotions tab daily or sometimes. DMNews reports it's actually "where people go to buy." But you need consistent engagement to stay visible there.
The new Purchases tab
Gmail added a separate Purchases tab in late 2025, splitting receipts and transaction confirmations away from promotional emails. Worth knowing because your post-purchase flows may now land in a different tab than your marketing campaigns — and the engagement signals between them won't mix.
Apple Mail Privacy Protection (MPP) and what it changed for deliverability
Apple Mail Privacy Protection (MPP), launched in iOS 15 and now the default behavior across Apple devices in 2026, fundamentally changed what "deliverability" can be measured with. Two things to know.
First, MPP inflates open rates by 15-20 percentage points because Apple's servers pre-fetch email images on the user's behalf — registering an "open" whether or not the user actually views the message. The Litmus 2025 State of Email report measures the inflation at 17pp on average across consumer ecommerce sends. A reported 50% open rate on a mostly-Apple-Mail audience is often a true ~30-33% open rate.
Second, MPP doesn't just inflate the metric — it degrades the signal mailbox providers use to score sender reputation. Gmail, Yahoo, and Outlook all factor engagement-quality signals into deliverability scoring. When opens become noise, the providers shift weight to clicks, replies, save-actions, and "move to primary inbox" gestures. This is partly why CTR and revenue-per-recipient (RPR) have become better deliverability-quality proxies than open rate.
Practical implication: stop reporting on opens alone. Pair open rate with CTR and unsubscribe-to-click ratio (covered below) to detect deliverability problems that opens hide. See our revenue per recipient post for the metric Apple MPP can't inflate.
Gmail proxy and image-loading: the engagement-signal problem
Gmail uses an image proxy: when a recipient opens a Gmail message, Gmail's servers fetch the embedded images, cache them, and serve them to the user. This was originally a privacy / security measure (it strips tracking pixels of some user-identifying data) but has compounded the same noise problem as Apple MPP.
For senders, this means:
- Open-tracking pixels load through Gmail's proxy — so opens can be registered for emails the user never actually viewed.
- Engagement signals shift toward clicks and active interactions — Gmail's algorithm increasingly weights "did the user click a link?" / "did they reply?" / "did they save the message?" rather than "did the open pixel fire?"
- Senders with high CTR but low open rate get less penalty than the reverse — because clicks survive the proxy + MPP noise. Open rate dominance is gone.
The 2026 sender's reality: your engagement-quality signal stack is now CTR + replies + saves + "move to primary inbox" gestures. Open rate sits in the bottom tier of useful signals.
Authentication requirements: what's now mandatory
The 2025-2026 email authentication stack
Gmail, Yahoo, and Microsoft now require:
| Requirement | What it does |
|---|---|
| SPF | Authorizes which servers can send on your behalf |
| DKIM | Cryptographic signature verifying email integrity |
| DMARC | Policy for handling authentication failures (none / quarantine / reject) |
| One-click unsubscribe (RFC 8058) | List-Unsubscribe-Post header with 2-day processing |
| Spam rate | Below 0.3% maximum; recommended below 0.10% |
| Volume threshold | Stricter enforcement for senders exceeding 5,000 daily messages |
The most under-implemented item on this list is the RFC 8058 List-Unsubscribe-Post header. Teams add a visible unsubscribe link to the email body but omit the header that Gmail specifically checks for. Per Google Postmaster Tools enforcement data and Validity 2026 reporting, this is the single most common point of partial compliance.
The adoption gap
| Metric | Adoption rate |
|---|---|
| Top 10M domains with valid DMARC | 18.2% |
| Top 10M domains enforcing DMARC policies | 7.6% |
| Emails with full auth still hitting spam | 30%+ |
Only 18.2% of the top 10 million domains have valid DMARC records. Only 7.6% enforce them. The overwhelming majority of email-sending domains are missing what is, at this point, a basic requirement.
And even with full authentication, spam placement rates still exceed 30%. Authentication gets you to the door. Engagement signals, sender reputation, and content quality determine whether you get through it.
"Proper authentication and deliverability work produce more incremental revenue than subject line tests or design changes. Before optimizing what's inside your emails, make sure they're arriving." — Israa A., Founder, 360Inbox (360inbox.com)
BIMI: brand logos in the inbox
BIMI (Brand Indicators for Message Identification) lets verified senders display their brand logo next to their messages in supported inboxes (Gmail, Yahoo, AOL, Apple Mail, and Fastmail in 2026). It's a visual trust signal that compounds with authentication.
To use BIMI, you need:
- DMARC at
p=rejectenforcement (the gateway requirement) - A trademarked logo in SVG Tiny PS format
- A Verified Mark Certificate (VMC) from a Certificate Authority — either DigiCert or Entrust
Adoption is climbing through 2026 — most enterprise senders have BIMI live or in pilot. For SaaS and DTC senders, BIMI is increasingly a category-leading signal: brands with verified logos in the inbox earn higher engagement rates (Google reports 39% lift in open rate among BIMI-eligible senders in 2025 testing).
Source: ExactVerify 2026 deliverability compliance report; Google BIMI 2025 enrollment data.
Microsoft and Outlook bulk-sender requirements (now active)
Microsoft activated comparable bulk-sender requirements for Outlook.com, Hotmail, and Live.com consumer inboxes starting May 5, 2025, mirroring the Gmail/Yahoo February 2024 enforcement. The requirements apply to senders shipping more than 5,000 emails per day to consumer Outlook domains.
Per Microsoft's Defender for Office 365 announcement:
Required for compliance:
- SPF must pass for the sending domain. DNS record must accurately list authorized IP addresses and hosts.
- DKIM must pass to validate email integrity and authenticity.
- DMARC at least
p=noneAND aligned with either SPF or DKIM (preferably both). Microsoft recommends moving gradually:none → quarantine → reject.
Recommended additional practices:
- Functional one-click unsubscribe in the header
- List hygiene and bounce management
- Transparent subject lines and consented mailing
- Compliant P2 (Primary) sender addresses
Enforcement phases:
- May 5, 2025 — active today: Non-compliant high-volume messages are routed to the Junk folder.
- Future (date to be announced): Non-compliant messages will be rejected outright rather than routed to junk.
"By focusing on senders of 5,000+ messages a day, we significantly reduce the likelihood of spam and spoofing campaigns reaching our user base." — Microsoft Defender for Office 365 team, Strengthening Email Ecosystem: Outlook's New Requirements for High-Volume Senders (Microsoft Tech Community)
The practical implication: senders who already comply with the February 2024 Gmail/Yahoo requirements need no additional work for Outlook. Senders who don't comply face active junk-folder routing today and full message rejection in the near future. If you're not yet at full DMARC alignment with p=none minimum, your Outlook deliverability is already being penalized — not hypothetically, but right now.
Adding p=quarantine or p=reject (Microsoft's recommended end state) protects you against the future rejection phase whenever Microsoft activates it.
Source: Microsoft Defender for Office 365 blog, Strengthening Email Ecosystem: Outlook's New Requirements for High-Volume Senders, version 4.0 published April 30, 2025.
Bounce rate benchmarks
2026 bounce rates by industry
| Industry | Soft bounce | Hard bounce |
|---|---|---|
| Daily Deals / E-coupons | 0.06% | 0.28% |
| Religion | 0.08% | 0.33% |
| E-commerce | 0.12% | 0.45% |
| Retail | 0.14% | 0.48% |
| Sports | 0.15% | 0.52% |
| Real Estate | 0.26% | 0.71% |
| Education / Training | 0.23% | 0.80% |
| Telecommunications | 0.50% | 1.31% |
| Software / Web Apps | 0.49% | 1.37% |
Source: Mailchimp 2026 Email Marketing Benchmarks.
Targets
| Metric | Safe | Warning | Danger |
|---|---|---|---|
| Hard bounces | <0.3% | 0.3-0.5% | >0.5% |
| Soft bounces | <1% | 1-1.5% | >1.5% |
| Total bounces | <1.5% | 1.5-2% | >2% |
Hard bounces mean permanent delivery failures — invalid addresses. A spike usually points to purchased lists, outdated data, or no validation at signup. ESPs will throttle or suspend accounts with persistently high hard bounce rates.
Email lists decay at roughly 22.5% per year (Validity 2026). You need constant maintenance and growth just to stay level.
Unsubscribe rate benchmarks
2026 unsubscribe rates by industry
Overall median: 0.22% (up from 0.08% in 2024 — MailerLite 2026)
| Industry | Unsub rate |
|---|---|
| Photo & Video | 0.40% (highest) |
| Restaurants & Cafes | 0.39% |
| Telecommunications | 0.34% |
| Art Gallery & Museum | 0.33% |
| Author | 0.31% |
| Health & Fitness | 0.30% |
| Manufacturing | 0.30% |
| Coaching | 0.30% |
| E-commerce | ~0.22% |
| Marketing & Advertising | 0.15% |
| Travel & Transportation | 0.13% |
| Religion | 0.13% |
| Higher Education | 0.10% |
| Media | 0.10% |
| Legal | 0.09% (lowest) |
Anything below 0.5% is generally healthy. But standard unsubscribe rates can be deeply misleading, which is why Jennings developed better ones.
Jennings' ratio metrics
Unsubscribe-to-click rate
Formula: (Unsubscribes / Unique Clicks) × 100
Target: Below 50%
Standard unsubscribe rates are denominator-dependent on total send volume. Send to 100,000 people and get 100 unsubscribes — that's 0.1%, looks fine. But if only 50 people clicked, you have a 200% unsubscribe-to-click ratio. For every person who engaged with your content, two people left your list.
Jennings found this exact pattern with a client. Their traditional unsubscribe rates sat comfortably below 0.5%. Their unsubscribe-to-click ratios were 200-400%. For every person who clicked, nearly three people unsubscribed. The surface metric said "healthy." The ratio said the content was driving people away.
Spam-complaint-to-click rate
Formula: (Spam Complaints / Unique Clicks) × 100
Target: Below 10%
Same idea: normalizing complaints against actual engagement catches problems that absolute rates hide. An absolute complaint rate of 0.05% might look fine, but if it's concentrated against a tiny number of clickers, you have a trust problem.
The difference in practice
Standard metrics on the same data:
- 0.1% unsubscribe rate on 100,000 sends = "acceptable"
- 0.05% spam complaint rate = "excellent"
Jennings' ratio metrics on the same data:
- 200% unsubscribe-to-click ratio = program in crisis
- 100% spam-to-click ratio = trust problem
Same numbers. Completely different conclusions. The standard metrics give a green light while the ratio metrics show a program that's actively failing.
"Deliverability is becoming a boardroom-level KPI in 2026. It's not a technical detail anymore — it's a revenue lever that determines the effectiveness of everything else you spend on email." — Kath Pay, Founder, Holistic Email Marketing (Holistic Email Academy)
The spam complaint threshold
Google and Yahoo enforce a hard ceiling:
| Threshold | Status |
|---|---|
| Below 0.10% | Safe — recommended target |
| 0.10-0.30% | Warning zone |
| Above 0.30% | Triggers throttling and spam placement |
| 3 per 1,000 emails | Google's enforcement line |
Cross 0.3% and Gmail will systematically reduce your inbox placement, which reduces engagement, which increases complaint rates, which further reduces placement. It feeds on itself.
One-click unsubscribe (RFC 8058) with 2-day processing is now mandatory. Counterintuitive but true: making it easy to unsubscribe protects your deliverability. You're giving dissatisfied subscribers an exit that doesn't damage your sender reputation. A spam complaint is far worse than an unsubscribe.
Deliverability scoring tools and what each one tells you
There isn't a single "email deliverability score." Different tools measure different parts of your reputation stack, and you need three or four of them to see the whole picture.
| Tool | What it measures | When to use it |
|---|---|---|
| Google Postmaster Tools (v2) | Gmail-specific sender reputation, IP reputation, spam rate, authentication errors, feedback loops | Mandatory for any sender shipping >5,000 daily messages to Gmail. Daily check. |
| Microsoft SNDS (Smart Network Data Services) | Outlook/Hotmail-specific IP reputation, complaint data, traps | Required visibility for high-volume Outlook senders. Weekly check. |
| SenderScore (by Validity) | Cross-provider sender reputation score (0-100) | Quick reputation snapshot. 70+ is healthy, below 60 needs attention. |
| 250ok / Validity Everest | Inbox placement testing across major providers using seed accounts | Pre-campaign inbox-placement preview. Premium tooling. |
| Inbox Monster | Real-time inbox placement monitoring across hundreds of seeds | Continuous monitoring rather than one-off testing. |
| GlockApps | Per-send inbox placement, spam score, authentication checks | Best for individual campaign testing. Affordable for SMB. |
| Mail-Tester | One-off authentication + content scoring (0-10) | Free tool. Quick pre-send sanity check. |
| MxToolbox | DNS, SPF, DMARC record validation; blacklist monitoring | Initial setup + ongoing blacklist watch. |
None of these tools gives you "the" deliverability score because no such score exists. Mailbox providers don't publish their algorithms. What these tools give you is a triangulated view: if Postmaster Tools shows healthy IP reputation, SenderScore shows 75+, GlockApps shows 90%+ inbox placement on a test send, and MxToolbox shows clean DMARC — you're probably in good shape. If three of them are healthy and one is flagging, that's where the work is.
Mobile and deliverability
Mobile devices generate roughly 60% of email opens in 2026 (Litmus 2025-2026 State of Email), and mobile-specific behavior compounds deliverability outcomes in two ways:
First, mobile users delete faster. Verified.email's 2026 research found that 50% of users delete emails that aren't mobile-optimized — many doing so within seconds. A wave of fast deletions is a negative engagement signal that Gmail and Yahoo factor into reputation scoring.
Second, mobile click-through and reply rates are the cleanest engagement signals left after Apple MPP and Gmail proxy degraded open data. Mobile users who tap a link are more reliably "engaged" than desktop users whose opens may have been auto-fired by image proxies.
Practical implications:
- Single-column layouts that render readably on mobile-first
- Tap-target CTAs (minimum 44×44 px per Apple's HIG, 48×48 px per Material Design)
- Subject lines under 40 characters to avoid mobile inbox truncation (cuts at 33-40 chars depending on app — see our cart subject lines post for the per-app truncation table)
- Image-light templates that render even when images don't load (still a meaningful fraction of users)
Mobile-optimization isn't just UX — it's a deliverability lever via engagement signals.
How to improve email deliverability
Eight ordered moves that consistently raise inbox placement and protect sender reputation, in priority order.
- Authenticate fully. SPF, DKIM, and DMARC. Move DMARC to
p=quarantine, thenp=rejectonce reports show no legitimate mail is failing alignment. - Implement RFC 8058 one-click unsubscribe. Not just a visible link in the body — the
List-Unsubscribe-Postheader that Gmail specifically checks for. This is the most common partial-compliance gap. - Suppress hard bounces immediately. Soft bounces after 3-5 attempts. Run monthly list-hygiene passes.
- Send only to engaged subscribers. Define "engaged" as opened or clicked in the last 90 days (or, given Apple MPP noise, prefer "clicked or replied in the last 90 days"). Move unengaged segments to a winback flow or suppress.
- Keep your spam complaint rate below 0.10%. Cross 0.30% and Gmail will throttle. Monitor weekly in Google Postmaster Tools.
- Warm up new domains and IPs gradually. Start at 5-10 messages per day and scale over 4-6 weeks. Avoid sudden volume spikes.
- Separate transactional, marketing, and cold outreach. Each has different engagement profiles. Mixing them on one sending domain pollutes reputation.
- Run incremental inbox-placement tests. GlockApps or Mail-Tester before any large campaign. Triangulate with SenderScore + Postmaster Tools for ongoing monitoring.
"MTA-STS, alongside DKIM, DMARC, and SPF, is the likely next requirement from Google and Yahoo. The senders who're ready for it are the ones with
p=rejectalready deployed and feedback loops monitored. Everyone else is going to be playing catch-up." — Chad White, Head of Research, Zeta Global (Email Marketing Rules)
Frequently Asked Questions
What is email deliverability?
Email deliverability is the ability for a sent email to reach the recipient's primary inbox rather than spam, junk, or a filtered tab. It's measured as the percentage of sent emails that achieve inbox placement. Per the Validity 2026 Email Deliverability Benchmark Report (covering 2025 data), the global average is 87.2%, with Gmail at 89.8%, Yahoo at 87.3%, Microsoft (Outlook/Hotmail) at 77.4%, and Apple Mail at 82%. Deliverability is shaped by sender reputation, authentication, engagement signals, list hygiene, and content quality.
What's the difference between email delivery and email deliverability?
Email delivery measures whether the receiving mail server accepted the message (industry average 98.16%). Email deliverability measures whether the message reached the primary inbox (87.2% global average per Validity 2026). The ~11-percentage-point gap represents emails that were accepted but routed to spam, junk, or a filtered tab. Delivery asks "was the email accepted?" Deliverability asks "did the recipient have a fair chance to see it?"
What is a good email deliverability rate in 2026?
A good email deliverability rate in 2026 is above 90% inbox placement, with 95%+ representing top-tier performance. The global average across industries climbed to 87.2% in 2025 per Validity 2026 — a 3.7pp uplift year over year. Anything below 80% indicates serious reputation, authentication, or list-quality problems. The benchmark to track is inbox placement (not delivery rate, which is uniformly high at 98%+). Use Google Postmaster Tools, SenderScore, and GlockApps to triangulate where you sit.
How do I check my email deliverability?
Use multiple tools to triangulate. Google Postmaster Tools v2 for Gmail-specific reputation (mandatory for senders above 5,000 daily messages). Microsoft SNDS for Outlook/Hotmail. SenderScore for cross-provider reputation. GlockApps or Mail-Tester for per-campaign inbox placement testing. MxToolbox for DNS/SPF/DMARC validation and blacklist monitoring. No single tool gives the complete picture — you need 3-4 of them.
How do I improve my email deliverability?
Authenticate with SPF, DKIM, and DMARC at p=reject enforcement. Implement RFC 8058 one-click unsubscribe (the List-Unsubscribe-Post header). Suppress hard bounces immediately, soft bounces after 3-5 attempts. Send only to engaged subscribers — define "engaged" as clicked or replied in the last 90 days (Apple MPP makes "opened" noisy). Keep spam complaint rate below 0.10%. Warm up new sending domains gradually. Separate transactional, marketing, and cold outreach onto different domains.
What is an email deliverability score?
There isn't a single canonical email deliverability score — different tools measure different parts of the reputation stack. SenderScore gives a 0-100 cross-provider reputation score (70+ healthy, below 60 needs attention). Mail-Tester gives a 0-10 content + authentication score. Google Postmaster Tools shows IP reputation tiered as Bad/Low/Medium/High. The honest answer: ignore tools that promise a single "deliverability score" and instead triangulate 3-4 specialized signals.
What are the best email deliverability tools?
For sender-reputation monitoring: Google Postmaster Tools v2 (Gmail) and Microsoft SNDS (Outlook) — both free, both essential. For inbox placement testing: GlockApps (affordable per-campaign) and Validity Everest / 250ok (premium, continuous). For DNS/auth checks: MxToolbox (free) and EasyDMARC (with deeper DMARC reporting). For cross-provider reputation: SenderScore by Validity. Most senders need 3-4 of these — none alone gives the full picture.
What causes email deliverability issues?
The most common causes in 2026: missing or partial authentication (especially the RFC 8058 one-click unsubscribe header that Gmail specifically checks for), spam complaint rate above 0.10%, high hard bounce rate from purchased or stale lists, low engagement (Apple MPP makes "opens" noisy — clicks and replies matter more), aggressive send-volume increases without warmup, and sender-domain reputation damage from past spam events. Authentication issues are the easiest to fix; reputation damage is the slowest.
Why are my emails going to spam?
Missing or misconfigured authentication (DMARC/DKIM/SPF), spam complaint rate above 0.10%, high bounces, low engagement, or sending to unengaged segments. Gmail's relevance sorting also buries low-engagement senders even when they're not literally in the spam folder — they're filed to Promotions tab, low-priority. Start by checking SPF/DKIM/DMARC alignment in MxToolbox, then run Google Postmaster Tools, then GlockApps to see where exactly your mail is landing.
What is the spam complaint threshold for Gmail?
Google enforces at 0.3% (3 per 1,000 emails) but recommends staying below 0.10%. Going over 0.3% triggers reduced inbox placement, which creates a feedback spiral: less visibility, less engagement, more complaints. The practical target is below 0.10% sustained — that gives you headroom for one-off campaigns that may drift higher. Monitor in Google Postmaster Tools v2.
How often should I clean my email list?
Lists decay at roughly 22.5% per year (Validity 2026). Remove hard bounces immediately. Suppress repeated soft bounces after 3-5 attempts. For subscribers inactive 90+ days, try a re-engagement campaign before suppressing. Monthly is a reasonable cadence for hygiene passes. For ecommerce stores running flows, suppression should be automated from your ESP — manual list cleaning shouldn't be a recurring task.
What is BIMI and does it affect deliverability?
BIMI (Brand Indicators for Message Identification) lets verified senders display their brand logo next to their messages in supported inboxes (Gmail, Yahoo, AOL, Apple Mail, Fastmail). It requires DMARC at p=reject, a trademarked logo in SVG Tiny PS format, and a Verified Mark Certificate from DigiCert or Entrust. BIMI doesn't directly affect deliverability, but it correlates with deliverability strongly — Google reports a 39% open-rate lift among BIMI-eligible senders in 2025 testing, largely because BIMI requires the same authentication discipline that drives strong inbox placement.
Continue the Series
Back to the pillar: 2026 Email Marketing Benchmarks by Industry
Related reading:
- Revenue Per Recipient (RPR) 2026 Benchmarks: $1.94 vs $0.11
- Email automation vs. campaigns: the 18x revenue gap most teams are ignoring
- Email attribution is broken: why your revenue numbers are probably wrong
- What is a good email open rate in 2026?
- 150+ Cart Abandonment Subject Lines That Convert (2026)
Sources
- Validity 2026 Email Deliverability Benchmark Report
- Mailchimp 2026 Email Marketing Benchmarks
- MailerLite 2025-2026 Benchmark Report
- Litmus 2025-2026 State of Email Report
- Mailforge.ai 2026 Domain Deliverability Benchmarks
- PowerDMARC — What is a Good Email Deliverability Rate in 2026
- Blueshift — Email Deliverability in 2026: Why It Is No Longer Just an ESP Issue
- ExactVerify 2026 Email Deliverability Compliance Guide
- Google Postmaster Tools
- Email Optimization Shop — Jeanne Jennings (ratio metrics framework)
- Holistic Email Academy — Kath Pay
- 360inbox.com — Israa A.
- Email Marketing Rules — Chad White
- ZeroBounce 2025 Promotions Tab Survey
- DMNews: "The Gmail Tab Marketers Fear"
Related reading from the WooCommerce email series
- WooCommerce + SendGrid in 2026: From Transactional-Only to Full-Funnel Without Migration — How to keep SendGrid's deliverability advantage on transactional email while routing marketing sends through a separate IP via an automation layer.

Co-Founder and CEO
Bob Thordarson is CEO and Co-Founder of Geysera, a serial entrepreneur with 25+ years and five co-founded ventures, including Cequint (acquired by TNS in 2010 for $112.5M) and Consumerware (acquired by ParkerVision). A graduate of the University of Washington and MIT Entrepreneurial Masters Program, based in Seattle, he serves on the boards of DRY Soda Co. and the Entrepreneurs' Organization Seattle chapter. He is an expert in retention marketing email systems and methodology for ecommerce and B2B brands — measured by incremental revenue, not vanity metrics.