The email metrics that actually matter in 2026
Still reporting open rates first? That hierarchy stopped making sense when Apple MPP inflated half the data. This post lays out a four-tier metrics framework — Revenue, Engagement, Health, and Strategic — built from 183K+ brands and 25 industry experts. It replaces the old open-rate-first playbook with a system that starts where it should: at the money.
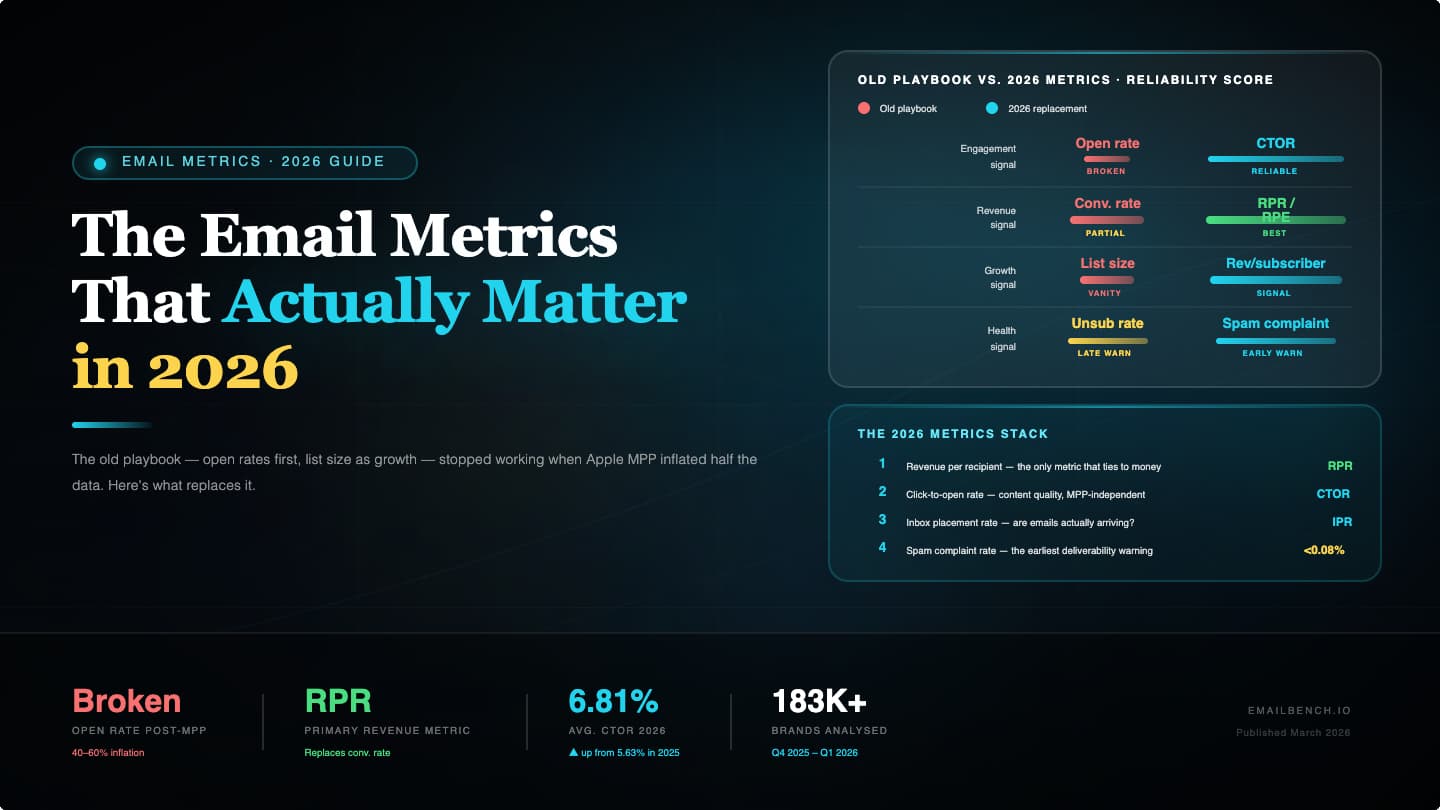
The old playbook — open rates first, list size as growth — stopped working when Apple MPP inflated half the data. Here's what replaces it.
Key takeaways
- The old framework (open rate, CTR, conversion, list size) is obsolete in a post-MPP world
- The new framework has four tiers: Revenue, Engagement, Health, and Strategic — each with its own review cadence
- Email subscribers have 320% higher lifetime value than non-subscribers
- Only 12% of marketers allocate more than 15% of their budget to email, despite it having the highest ROI
- Cohort analysis reveals trends that campaign-level averages hide
Most email teams still report metrics in the order they've always reported them: open rate first, then click rate, then maybe conversion somewhere at the bottom. That hierarchy made sense before 2021. It doesn't anymore.
Apple MPP inflated open rates by 15-20 points. Bot clicks compromise CTR. Last-click attribution inflates revenue numbers. The metrics haven't disappeared, but the ones everyone leads with are now the least reliable.
What follows is a four-tier framework built from data across 183,000+ brands and conversations with 25 of the industry's leading practitioners. It starts with revenue — not because engagement doesn't matter, but because the whole point of email is to make money, and the metrics closest to money are the ones least corrupted by platform changes.
This post is part of our 2026 Email Marketing Benchmarks series.
The old framework vs. the new
Pre-2022 email metrics hierarchy
| Priority | Metric | Problem in 2026 |
|---|---|---|
| 1 | Open rate | Inflated 15-20 points by MPP |
| 2 | Click-through rate | Compromised by bot clicks |
| 3 | Conversion rate | Inflated by last-click attribution |
| 4 | List size | Growth without quality is vanity |
The 2026 four-tier framework
Built on expert consensus and validated against benchmark data from Klaviyo, MailerLite, Omnisend, and Litmus.
Tier 1: Revenue metrics (review weekly)
These are your primary decision-making metrics. Strategic choices should ultimately be justified by their impact here.
| Metric | What it tells you | Target | How to calculate |
|---|---|---|---|
| Revenue Per Recipient (RPR) | Dollar value per person reached | Campaigns: >$0.11; Flows: >$1.94 | Total Revenue / Unique Recipients |
| Flow-level conversion rate | Purchase rate by automation type | Abandoned cart: >10%; Welcome: >3% | Orders / Flow Recipients x 100 |
| Customer Lifetime Value (CLV) | Long-term subscriber value | CLV:CAC ratio >3:1 | Avg Order Value x Purchase Frequency x Customer Lifespan |
| Incremental revenue | Revenue that wouldn't exist without email | Requires holdout testing | Email Group Revenue - Holdout Group Revenue |
Why RPR belongs on every dashboard
RPR connects email activity directly to revenue. It reveals the 18x gap between flows ($1.94) and campaigns ($0.11). It shows which emails generate money and which generate activity. And unlike open rates and click rates, it's not inflated by bots or privacy features.
Jeanne Jennings (founder of Email Optimization Shop) uses a variation — RPME (Revenue Per 1,000 Emails Delivered) — for larger programs. Her Scholastic case study: reducing send volume 10% per quarter while improving targeting produced a 150% RPME increase. Fewer emails. More money per email.
Related: Revenue per email: the metric that should have replaced open rates
Why CLV is the real north star
Email subscribers have 320% higher lifetime value than non-subscribers. But while 76% of companies say CLV is important, only 42% can actually measure it.
| Benchmark | Target |
|---|---|
| CLV:CAC ratio minimum | 3:1 |
| Annual retention improvement | 5% |
| CLV premium for omnichannel customers | 30% |
| Revenue gains from personalization | 40% |
CLV connects email to business strategy instead of campaign tactics. A welcome series that drives low immediate conversion but high 12-month CLV is more valuable than a flash sale that drives high conversion but zero repeat purchases.
Tier 2: Engagement metrics (review weekly)
These tell you whether your content is working and whether your subscribers are healthy.
| Metric | What it tells you | Target | How to calculate |
|---|---|---|---|
| Click-through rate | Intentional engagement signal | Campaigns: >2%; Flows: >5% | Unique Clicks / Emails Delivered x 100 |
| Click-to-conversion rate | Content-to-purchase efficiency | >9% | Conversions / Unique Clicks x 100 |
| Unsubscribe-to-click rate | Content alienation signal | <50% | Unsubscribes / Unique Clicks x 100 |
| Spam-complaint-to-click rate | Trust erosion signal | <10% | Spam Complaints / Unique Clicks x 100 |
Jennings' ratio metrics
Jennings created the unsubscribe-to-click and spam-complaint-to-click rates to solve a specific problem: standard unsubscribe and complaint rates are denominator-dependent on total send volume, which hides content quality issues behind big numbers.
She found a client with 0.5% unsubscribe rates — looks fine by any standard. But their unsubscribe-to-click ratios were 200-400%. For every person who clicked, three people left. The surface metric said healthy. The ratio said the content was driving people away.
Click-to-conversion at 9%
Click-to-conversion hit 9% in 2025, up 53% year-over-year. One in three automated email clickers makes a purchase. For welcome and abandoned cart flows, it's one in two.
This metric tells you whether your email content and landing page experience work together. A high CTR with low click-to-conversion means people are interested, but the destination disappoints them.
Tier 3: Health metrics (review monthly)
These don't tell you whether you're winning. They tell you whether the foundation is sound.
| Metric | What it tells you | Target | How to calculate |
|---|---|---|---|
| Inbox placement rate | Deliverability health | >85% | Inbox deliveries / Total sent x 100 |
| Bounce rate | List hygiene | <2% total | Bounces / Emails Sent x 100 |
| List growth rate | Audience momentum | 1-3%/month | (New subs - Unsubs - Bounces) / Total List x 100 |
| Open rate (MPP-filtered) | Directional deliverability signal | Track trend only | Use ESP's MPP exclusion filter |
List growth context
- Industry average growth: 1-3% per month (12-36% annually)
- Companies using multiple opt-in methods: 40% faster growth
- Email lists naturally decay at ~22.5% per year
- Global email users: projected to exceed 4.7 billion by the end of 2026
Your list growth rate has to exceed the 22.5% annual decay rate just to maintain the current audience size. Growth below 2% per month likely means your list is shrinking in real terms.
Related: Email deliverability in 2026
Tier 4: Strategic metrics (review quarterly)
These inform high-level strategy and resource allocation.
| Metric | What it tells you | Target | How to calculate |
|---|---|---|---|
| Email revenue as % of total | Channel dependency/opportunity | 20-30% for ecommerce | Email Revenue / Total Revenue x 100 |
| Automation revenue as % of email revenue | Passive income efficiency | >30% | Flow Revenue / Total Email Revenue x 100 |
| Cohort retention curves | Are newer subscribers as valuable? | Non-declining curves | Cohort analysis by signup date |
| RPME trend | Revenue efficiency over time | Increasing QoQ | Track RPME quarter-over-quarter |
Why cohort analysis matters more than campaign averages
Campaign-level metrics are point-in-time snapshots. Your overall retention might look stable while your most recent acquisition cohort churns at twice the rate. Your RPME might be flat while newer subscribers generate half the revenue of older ones.
Two cohort types to track
Acquisition cohorts (grouped by signup date): track retention rate, purchase rate, and revenue per subscriber over time. These reveal whether subscriber quality is improving or deteriorating and help evaluate the quality of acquisition sources.
Behavioral cohorts (grouped by actions taken): track progression through lifecycle stages and churn triggers. These reveal why certain subscribers disengage, and where the optimization points are in onboarding and the purchase cycle.
What cohort analysis shows that campaign metrics can't
| Campaign view | Cohort view |
|---|---|
| "Open rate is 38% this month" | "Q4 2025 signups open at 45%; Q1 2026 signups open at 31%" |
| "Revenue is steady at $200K/month" | "Per-subscriber revenue declining 5% per cohort" |
| "Unsubscribe rate is 0.2%" | "New subscribers unsubscribe at 3x the rate of established ones" |
Same program, same time period, completely different conclusions depending on how you look at the data.
The owned audience argument
| Channel performance | Stat |
|---|---|
| Marketers citing email as best ROI | 26.9% |
| SMBs citing email as most effective channel | 44% (nearly 2x prior year) |
| Adults preferring email for offers | 59% |
| Google queries now zero-click | 69% |
| Organic CTR drop when AI Overviews appear | 61% |
With 69% zero-click searches and organic CTR dropping 61% when AI Overviews appear, email's value as a direct subscriber relationship keeps growing. Social algorithms prioritize paid content. Search engines answer questions without sending traffic. Email is the channel where you own the audience.
And yet: only 12% of marketers allocate more than 15% of budget to email. Twenty-two percent spend less than 5%. The highest-ROI channel gets some of the lowest investment.
Expert predictions: where email metrics are headed
A few themes came up repeatedly.
Chad White (Zeta Global) and Kath Pay (Holistic Email Academy) both see deliverability and sender reputation becoming boardroom-level concerns. As AI intermediaries sit between brands and inboxes, the direct subscriber relationship becomes email's most defensible advantage. Pay also pushes for hypothesis-led testing and integrating buyer psychology into strategy, not just subject lines.
Jeanne Jennings (Email Optimization Shop) sees the email marketer's role shifting from campaign executor to lifecycle architect. First-party data is the strategic asset. Welcome series alone can triple RPME compared to routine campaigns.
Jay Schwedelson (SubjectLine.com) keeps finding that counterintuitive subject-line approaches outperform "best practices" across his 6-billion-email dataset. His argument: one-size-fits-all averages are obsolete. What works for a flash sale bombs for a nurture sequence.
Alex Greifeld (No Best Practices) and Eli Weiss (Yotpo) both argue the same thing from different angles: metrics don't matter if the product is bad. Greifeld wants brands to measure what percentage of email revenue is truly incremental. Weiss says the best email metrics belong to brands with the best products, full stop.
Val Geisler (Fix My Churn) is pushing for subscriber health to be measured holistically — combining email engagement with product usage, support interactions, and purchase patterns. Not just opens and clicks.
Chris Orzechowski (Orzy Media) thinks A/B testing subject lines is table stakes. The real leverage is testing entire strategic approaches: long-form vs. short-form, story-driven vs. offer-driven. The metric is always revenue.
Implementing the framework: 30-day rollout
Start with RPR and RPME tracking — set it up in your ESP and pull baseline numbers for the last 90 days. That's week one.
Week two, calculate Jennings' ratio metrics (unsubscribe-to-click and spam-to-click) for your last 10 campaigns. You may find content problems that standard metrics were hiding.
Week three, build your first cohort report. Segment by signup month, track 30/60/90-day engagement and revenue curves.
Week four, run your first incrementality test. Hold out 10% of abandoned cart recipients for 14 days and see what the true incremental purchase rate looks like. The number may be uncomfortable. That's the point.
Related: Email attribution is broken | 2026 benchmark reference tables by industry
Frequently asked questions
What email metrics should I track in 2026?
RPR and flow-level conversion rates weekly. CTR and Jennings' ratio metrics (unsubscribe-to-click, spam-to-click) for engagement. Inbox placement and bounce rates monthly. Cohort retention and RPME trends quarterly.
What is Unsubscribe-to-Click Rate?
(Unsubscribes / Unique Clicks) x 100. Target: below 50%. It catches content problems that standard unsub rates miss. A 0.5% unsub rate can mask a 200-400% unsubscribe-to-click ratio — meaning your content is driving away the people who engage.
Why is cohort analysis important for email?
Campaign averages hide variability. Your retention might look stable while recent cohorts churn faster. Cohort analysis shows whether subscriber quality is improving or degrading, which acquisition sources produce the best subscribers, and whether flow changes actually affect long-term behavior.
How do I measure customer lifetime value from email?
CLV = Average Order Value x Purchase Frequency x Customer Lifespan. Email subscribers have 320% higher CLV than non-subscribers. Target CLV:CAC above 3:1. Track by acquisition cohort and source to find your highest-value subscriber channels.
Why does email get so little budget despite having the highest ROI?
About half of companies can't properly measure email ROI, which makes it hard to advocate for internally. Email teams tend to be small, lack executive sponsorship, and the channel has an "unglamorous" reputation compared to newer ones. The data says it should get more. It usually doesn't.
Related guides:
- What is a good email open rate in 2026?
- Revenue per email: the replacement metric
- Browse abandonment emails: complete strategy guide
- Abandoned cart email: ultimate recovery guide
Sources
- Klaviyo 2026 Email Marketing Benchmarks (183,000+ brands)
- MailerLite 2025-2026 Benchmarks
- Omnisend 2025-2026 Report
- Litmus State of Email 2025-2026
- HubSpot Marketing Statistics 2026
- Sprout Social 2025 Index
- Chad White, emailmarketingrules.com
- Jeanne Jennings, emailopshop.com
- Jay Schwedelson, jayschwedelson.com
- Alex Greifeld, nobestpractices.co
- Val Geisler, valgeisler.com
- Eli Weiss, Yotpo
- Chris Orzechowski, theemailcopywriter.com
Part of the 2026 Email Marketing Benchmarks series by Geysera

Co-Founder and CEO
Bob Thordarson is CEO and Co-Founder of Geysera, a serial entrepreneur with 25+ years and five co-founded ventures, including Cequint (acquired by TNS in 2010 for $112.5M) and Consumerware (acquired by ParkerVision). A graduate of the University of Washington and MIT Entrepreneurial Masters Program, based in Seattle, he serves on the boards of DRY Soda Co. and the Entrepreneurs' Organization Seattle chapter. He is an expert in retention marketing email systems and methodology for ecommerce and B2B brands — measured by incremental revenue, not vanity metrics.