2026 Email Marketing Benchmarks by Industry: The Complete Reference [Updated April 2026]
Think your 31% open rate is bad? It depends on your industry — Religion hits 55.71%, Travel sits at 30.10%, and all of those numbers are inflated by 15-20 points anyway. This is the complete 2026 benchmark reference: 10 tables covering open rates, CTR, RPR, deliverability, regional data, SMS vs. email, AI impact, and send times — sourced from 183K+ brands and 3.6M campaigns. Bookmark it and stop Googling "average email open rate" every quarter.
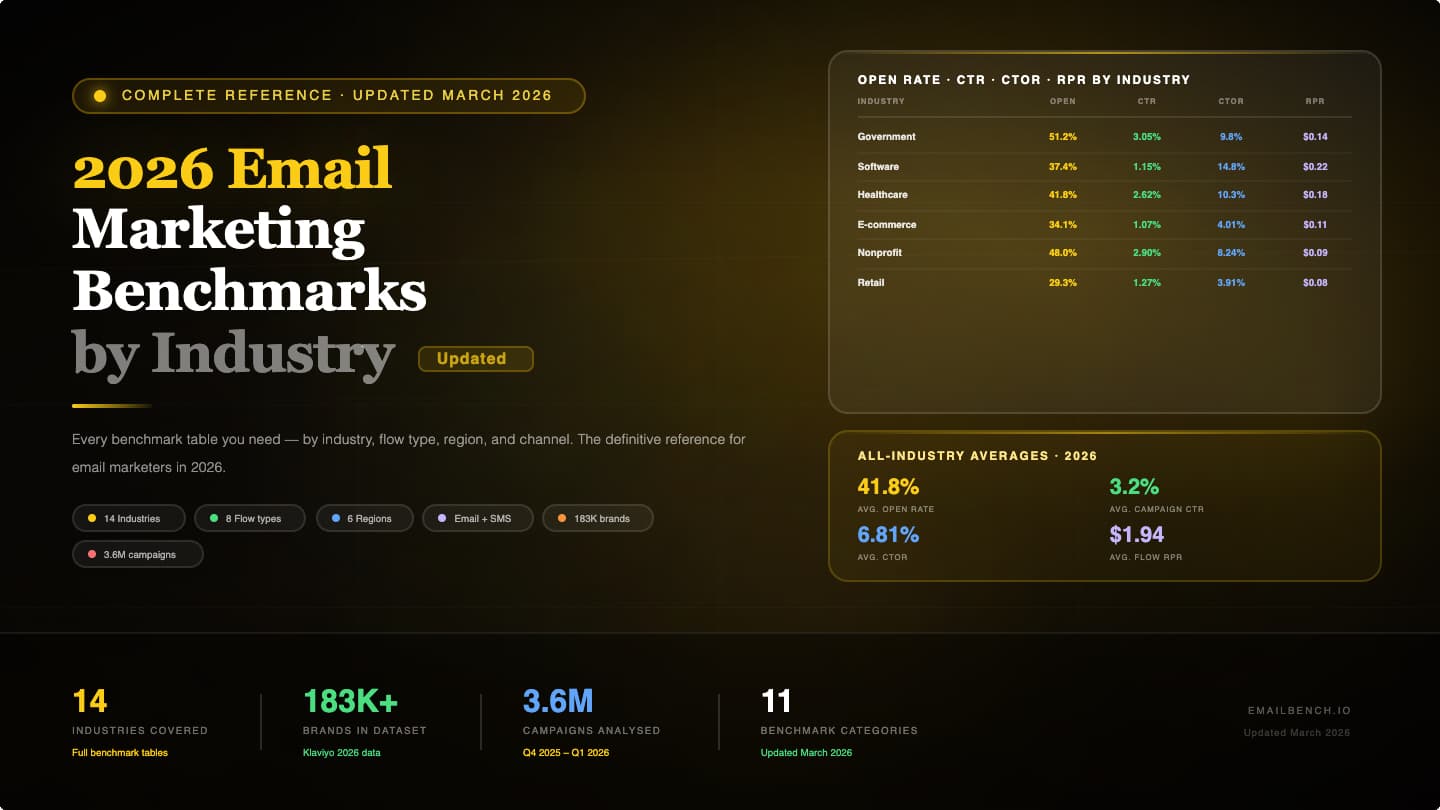
Every benchmark table you need — by industry, flow type, region, and channel. The definitive reference for email marketers in 2026.
Part 11 of 11 in the 2026 Email Marketing Benchmarks. Previous: SMS vs. Email ←
Key Findings
- Automated flows outperform campaigns by 13-18x on revenue metrics across all industries
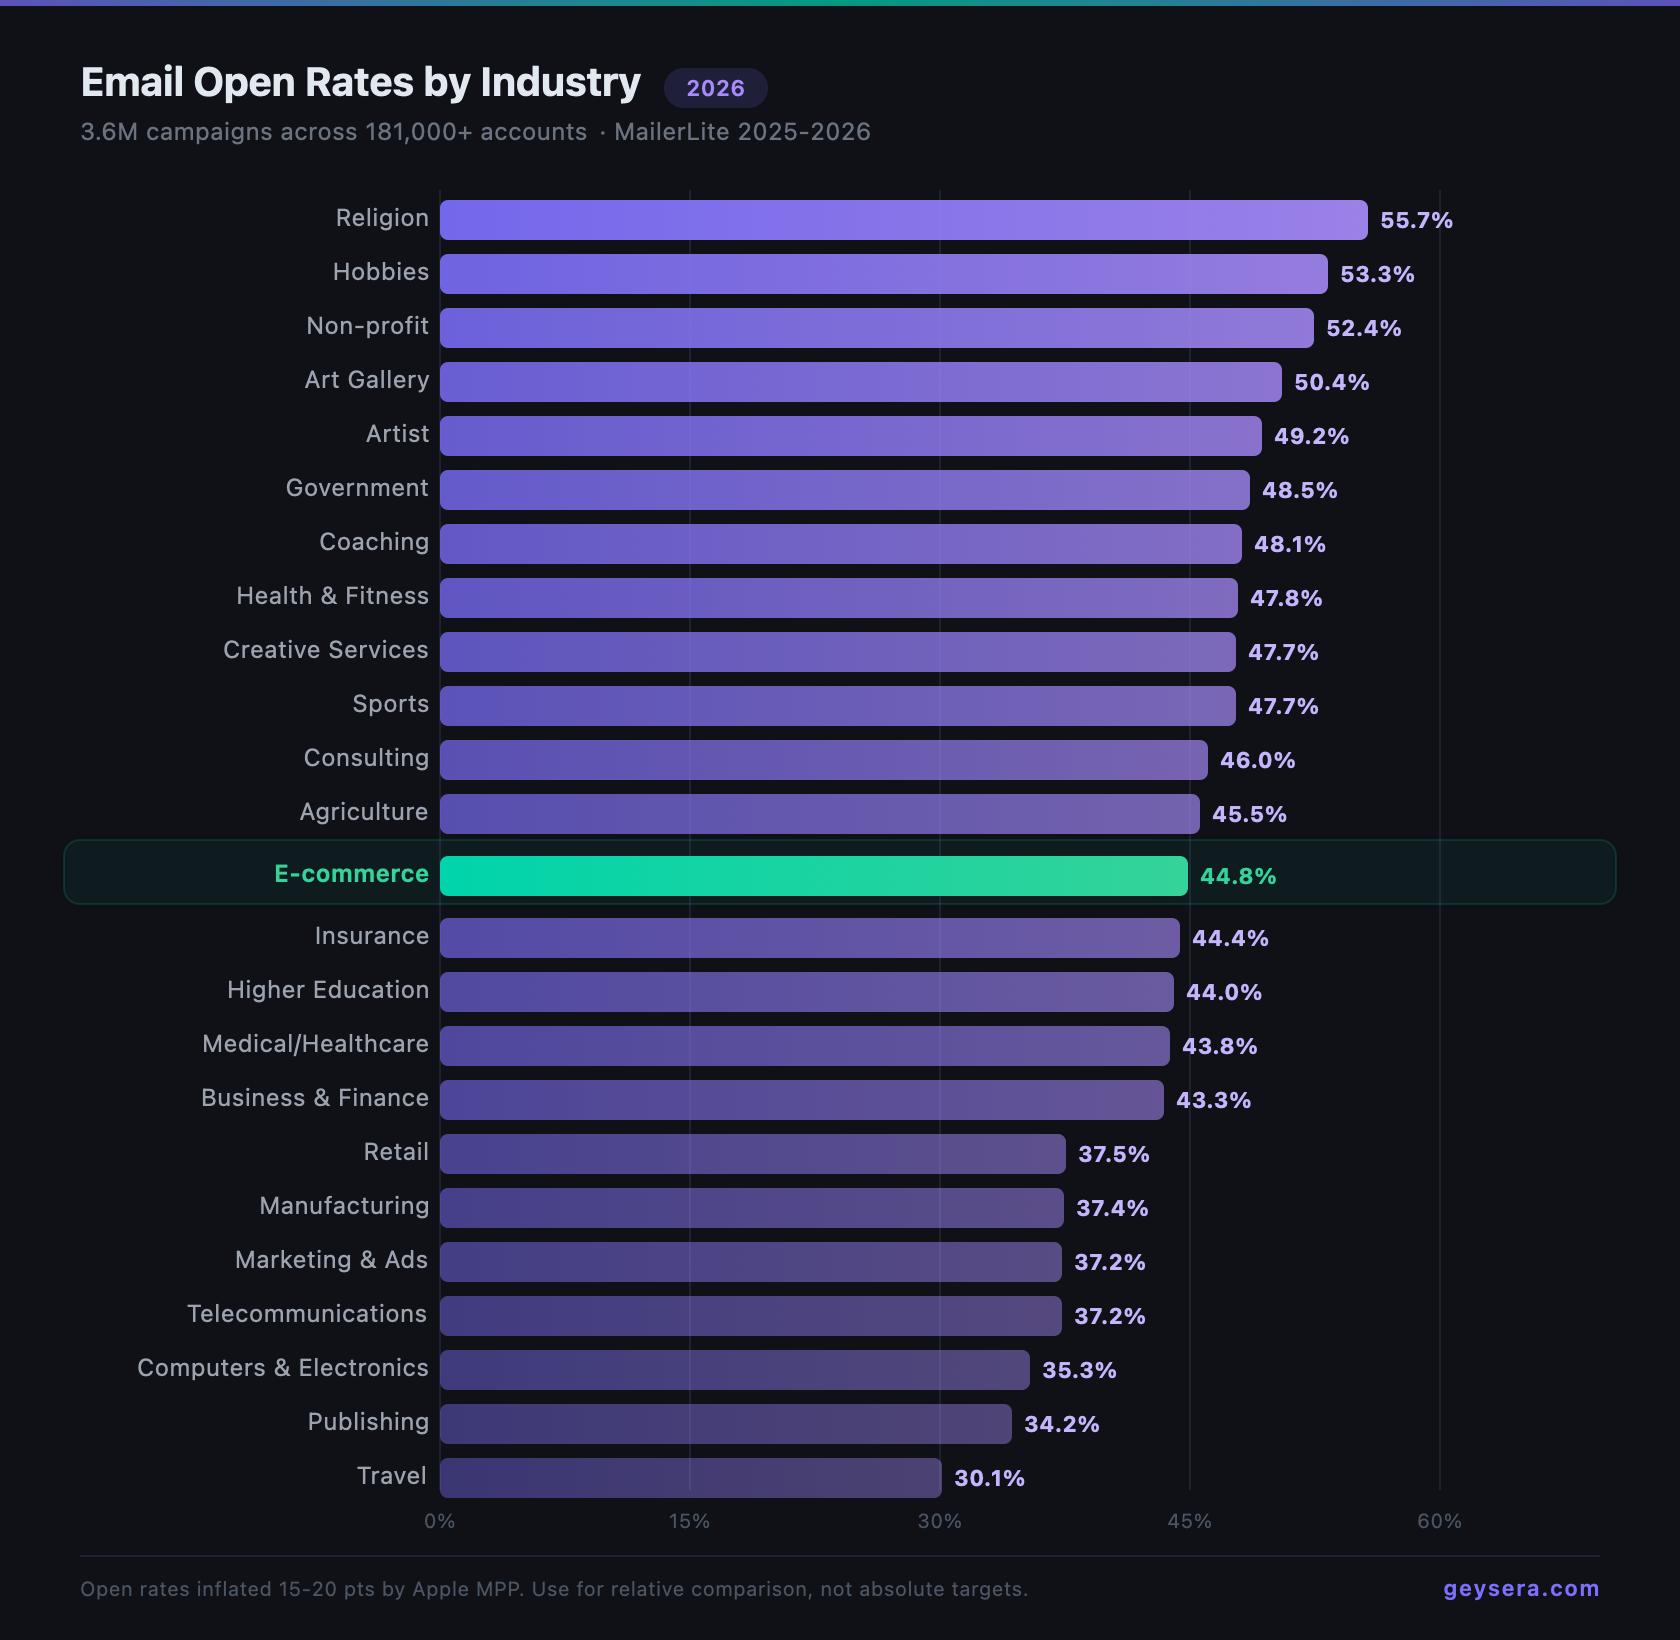
- Religion (55.71%) and Hobbies (53.25%) lead open rates; Travel (30.10%) trails
- Legal (4.90%) and Manufacturing (4.22%) dominate CTR; Politics (0.83%) and Beauty (0.95%) trail
- Gmail inbox placement dropped to 53.7% — nearly half of marketing emails miss the primary inbox
- Oceania leads regional engagement (46.34% open rate); Asia-Pacific trails (19.14%)
This is the comprehensive benchmark reference for email marketing in 2026. All data is sourced from Klaviyo (183,000+ brands), MailerLite (3.6 million campaigns from 181,000+ accounts), Omnisend, GetResponse, Mailchimp, Litmus, and the Validity Deliverability Report. Bookmark this page — we update it quarterly.
Important caveat: Open rates across all tables are inflated by Apple Mail Privacy Protection (49% of opens) by an estimated 15-20 percentage points. Use them for relative comparison between industries, not as absolute performance targets. For context on this inflation, read: Are Email Open Rates Dead in 2026?
This post is part 11 of 11 of our 2026 Email Marketing Benchmarks series.
Table 1: Campaign Benchmarks by Industry
Source: MailerLite 2025-2026, 3.6M campaigns, 181,000+ accounts
| Industry | Open Rate | CTR | CTOR | Unsub Rate |
|---|---|---|---|---|
| Religion | 55.71% | 2.95% | — | 0.13% |
| Hobbies | 53.25% | 3.30% | 8.45% | 0.24% |
| Non-profit | 52.38% | 2.90% | 8.24% | 0.18% |
| Art Gallery & Museum | 50.43% | — | — | 0.33% |
| Artist | 49.23% | — | — | — |
| Government | 48.52% | 3.05% | 8.44% | — |
| Coaching | 48.07% | — | — | 0.30% |
| Health & Fitness | 47.81% | — | — | 0.30% |
| Creative Services/Agency | 47.69% | — | — | — |
| Sports | 47.69% | 1.27% | 3.35% | — |
| Consulting | 45.96% | — | — | — |
| Agriculture & Food | 45.51% | — | — | — |
| E-commerce | 44.78% | 1.07% | 4.01% | ~0.22% |
| Insurance | 44.40% | — | 3.19% | — |
| Higher Education | 43.98% | — | 9.15% | 0.10% |
| Medical/Dental/Healthcare | 43.75% | — | — | — |
| Business & Finance | 43.34% | — | — | — |
| Retail | 37.47% | 1.27% | — | — |
| Manufacturing | 37.36% | 4.22% | 14.82% | 0.30% |
| Marketing & Advertising | 37.23% | — | — | 0.15% |
| Telecommunications | 37.21% | — | — | 0.34% |
| Computers & Electronics | 35.29% | — | — | — |
| Publishing Company | 34.24% | — | 9.12% | — |
| Travel & Transportation | 30.10% | — | — | 0.13% |
What this means: Industries with passionate, self-selected audiences (Religion, Hobbies, Non-profit) lead on open rates. Industries with high-stakes, actionable content (Legal, Manufacturing) lead on CTR. Visual/browse-heavy industries (E-commerce, Beauty, Retail) have low CTR because subscribers consume content without clicking through.
Embed This Chart on Your Site
<a href="https://www.geysera.com/blog/email-marketing/2026-email-marketing-benchmarks-by-industry-the-complete-reference-updated-march-2026"><img src="https://dliqujzbgyvclfdcjvdm.supabase.co/storage/v1/object/public/media/blog/1776994884079-auilmc.png" alt="Email open rates by industry 2026 — 24 industries ranked from 3.6M campaigns" width="800">
  </a>
  <p><small>Source: <a href="https://www.geysera.com/blog/email-marketing/2026-email-marketing-benchmarks-by-industry-the-complete-reference-updated-march-2026">2026 Email Marketing Benchmarks</a> by Geysera. Data: MailerLite (3.6M campaigns).</small></p>
Table 2: Ecommerce Campaign Benchmarks by Sector
Source: Klaviyo 2026, 183,000+ brands
| Sector | Open Rate | Click Rate | Placed Order Rate | RPR |
|---|---|---|---|---|
| Clothing & Accessories | 33.1% | 1.80% | 0.17% | $0.12 |
| Food & Beverage | 32.5% | 1.75% | 0.18% | $0.16 |
| Health & Beauty | 31.8% | 1.60% | 0.15% | $0.10 |
| Sporting Goods | 31.2% | 1.90% | 0.16% | $0.13 |
| Automotive | 30.5% | 1.65% | 0.14% | $0.16 |
| Mass Merchant | 28.7% | 1.45% | 0.12% | $0.09 |
| Overall Average | 31% | 1.69% | 0.16% | $0.11 |
| Top 10% | 45.1% | 3.99% | 0.36% | $0.97 |
What this means: The gap between average and top 10% is enormous — top performers earn 9x more RPR per campaign. Improving from average to top 10% is worth more than any industry switch.
Table 3: Automated Flow Benchmarks by Flow Type
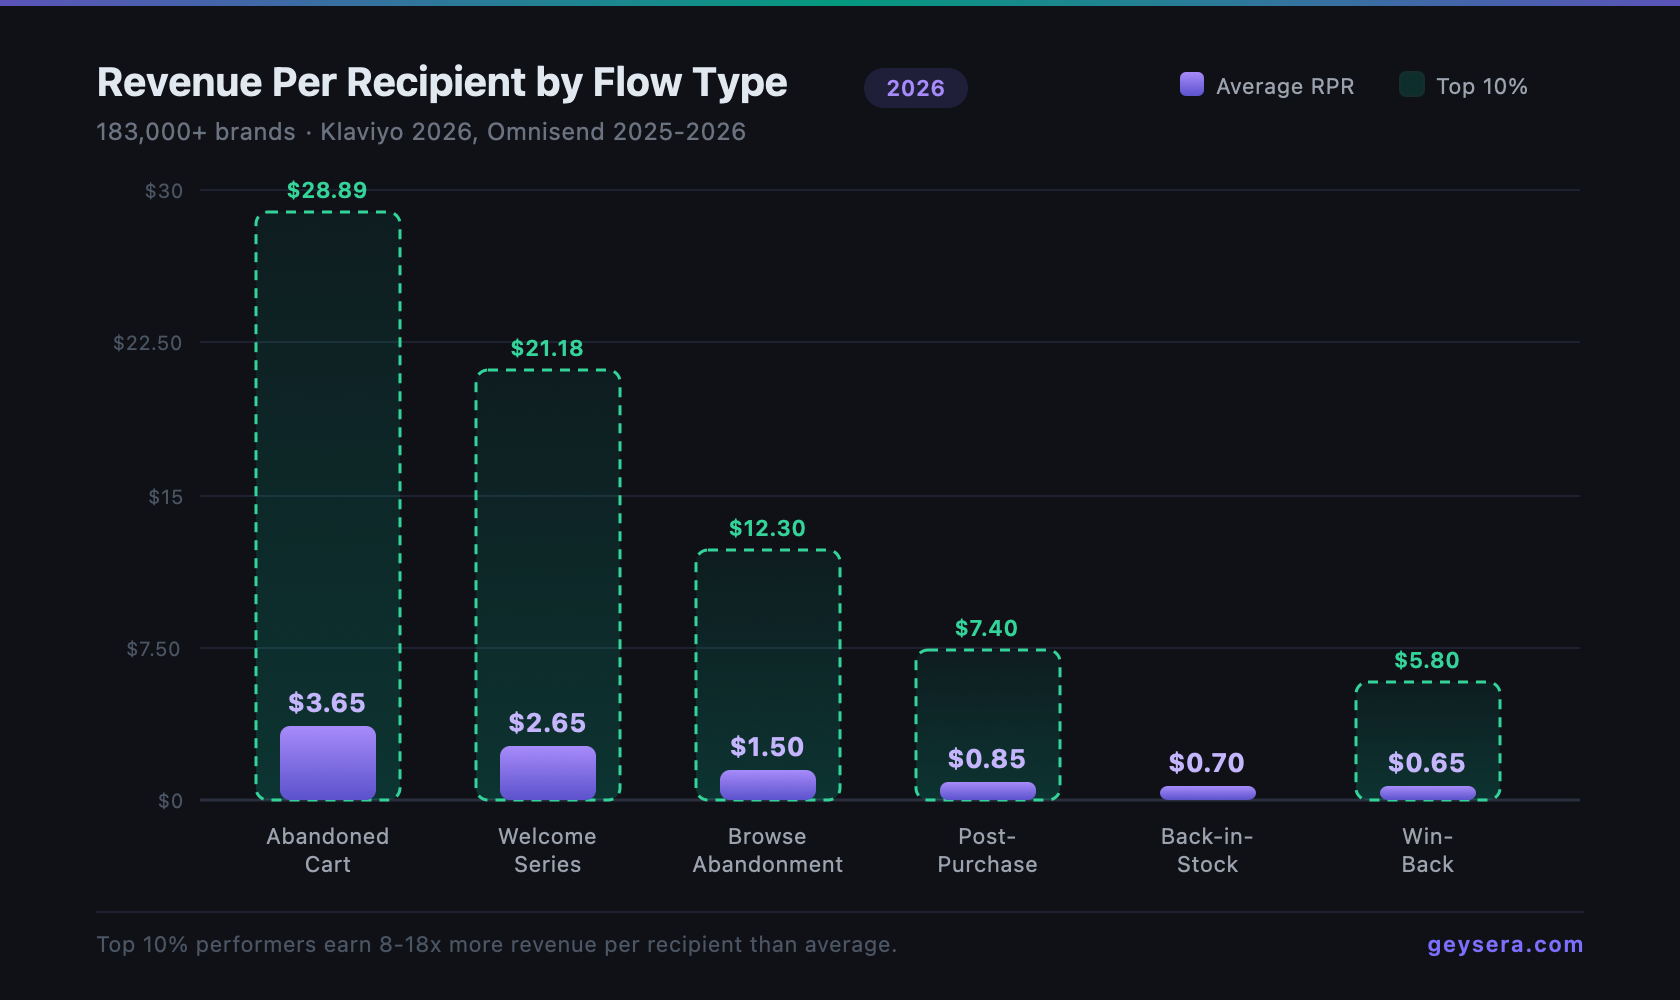
Source: Klaviyo 2026, Omnisend 2025-2026
| Flow Type | Open Rate | CTR | Conversion Rate | Avg RPR | Top 10% RPR |
|---|---|---|---|---|---|
| Welcome Series | ~50% | 23.33% | ~3% | $2.65 | $21.18 |
| Abandoned Cart | 39.07% | 23.33% | 10.7% | $3.65 | $28.89 |
| Browse Abandonment | ~35% | ~8% | ~2% | $1.50 | $12.30 |
| Post-Purchase | ~65% | 12% | 6.8% | $0.85 | $7.40 |
| Back-in-Stock | ~45% | 18% | 6.46% | $0.70 | — |
| Win-Back | ~30% | ~5% | ~1.5% | $0.65 | $5.80 |
| Birthday | ~45% | ~12% | — | — | — |
| Overall Flows | 38-42% | 5.58% | 2.11% | $1.94 | $16.96 |
What this means: Abandoned cart flows generate the highest RPR ($3.65 avg, $28.89 top 10%) but welcome series may be the most undervalued — Jennings notes they can triple RPME compared to routine campaigns. Birthday emails produce $744.37 average order value (4x normal). One in two welcome/abandoned cart clickers makes a purchase.
For implementation guidance: Email Automation vs. Campaigns: Why Flows Generate 18x More Revenue
For subject line optimization: 100+ abandoned cart email subject lines sorted by sequence position
Embed This Chart on Your Site
<a href="https://www.geysera.com/blog/email-marketing/2026-email-marketing-benchmarks-by-industry-the-complete-reference-updated-march-2026">
    <img src="https://dliqujzbgyvclfdcjvdm.supabase.co/storage/v1/object/public/media/blog/1777001688224-liuuar.png" alt="Revenue per recipient by email flow type 2026 — abandoned cart leads at $3.65 avg" width="800">
  </a>
  <p><small>Source: <a href="https://www.geysera.com/blog/email-marketing/2026-email-marketing-benchmarks-by-industry-the-complete-reference-updated-march-2026">2026 Email Marketing Benchmarks</a> by Geysera. Data: Klaviyo (183K+ brands).</small></p>
Table 4: Campaigns vs. Flows — Side-by-Side Comparison
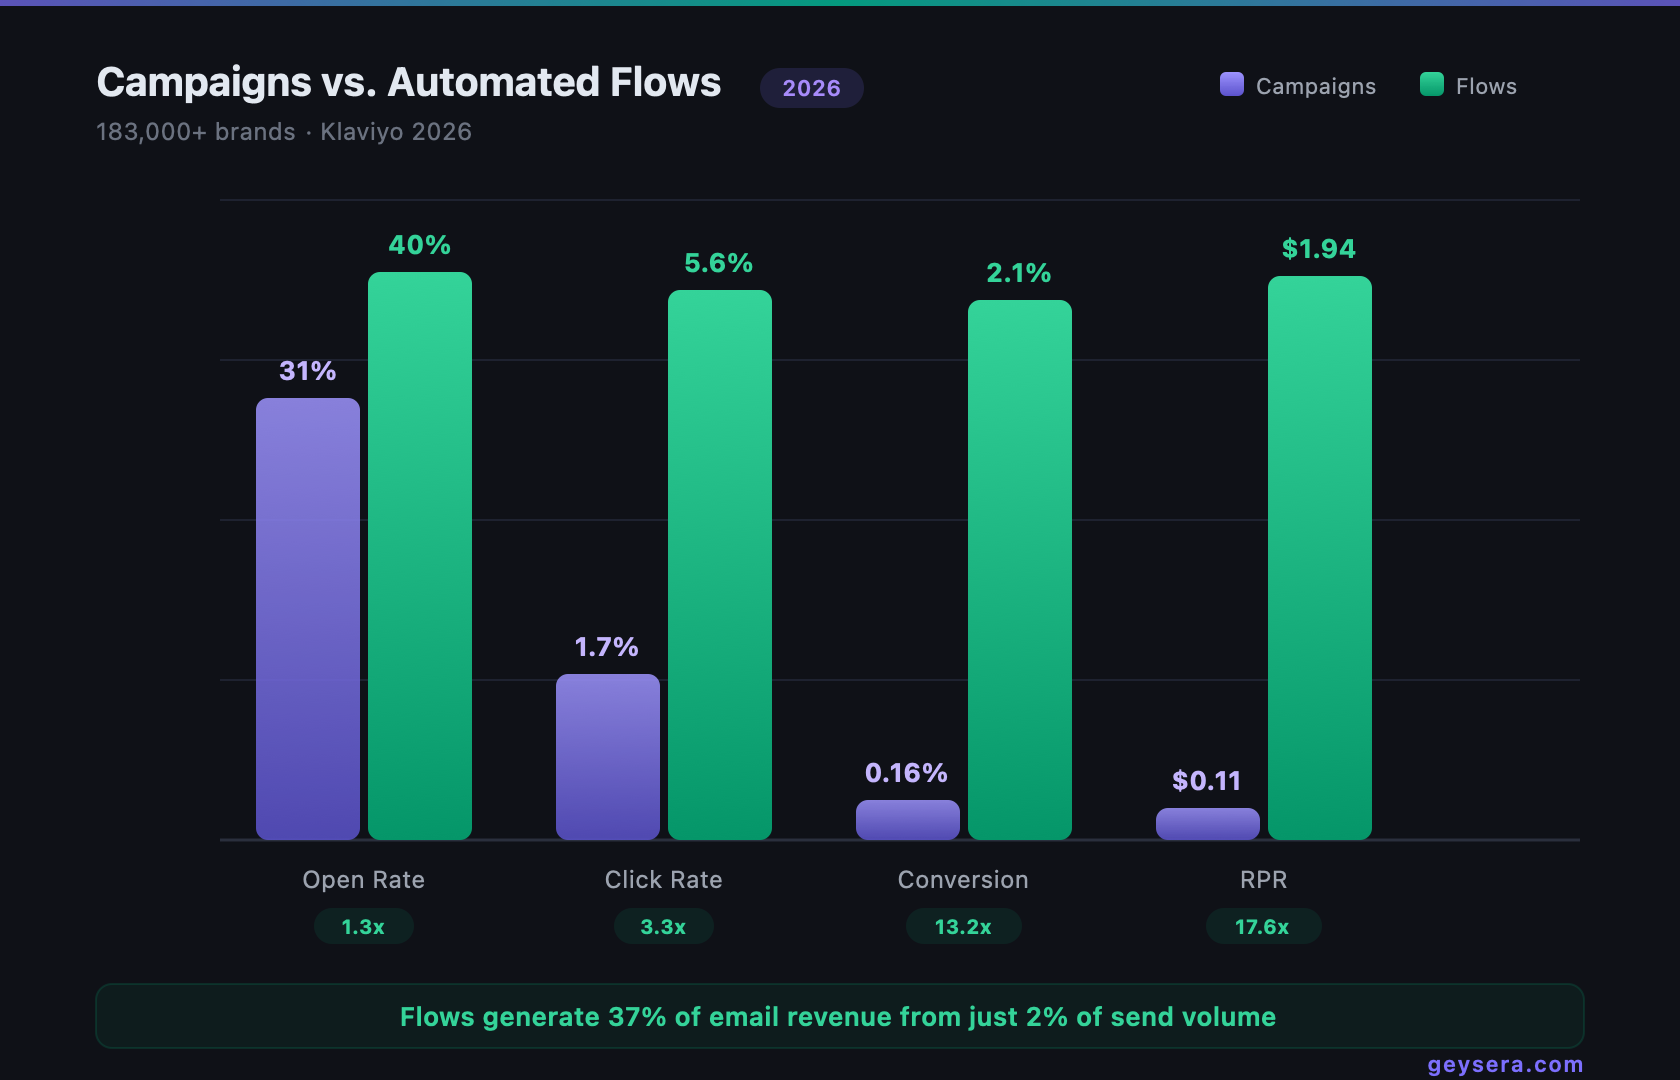
Source: Klaviyo 2026
| Metric | Campaigns | Automated Flows | Flow Advantage |
|---|---|---|---|
| Open Rate | 31% | 38-42% | 1.3x |
| Click Rate | 1.69% | 5.58% | 3.3x |
| Placed Order Rate | 0.16% | 2.11% | 13.2x |
| RPR (Revenue Per Recipient) | $0.11 | $1.94 | 17.6x |
| Top 10% RPR | $0.97 | $16.96 | 17.5x |
| Revenue per email (Omnisend) | $0.18 | $2.87 | 15.9x |
| Share of send volume | ~98% | ~2% | — |
| Share of email revenue | ~63% | ~37% | — |
What this means: Flows outperform campaigns by 13-18x on revenue metrics while using just 2% of send volume. This is the single most important strategic insight in email marketing — automation should receive proportionally more investment than most teams allocate.
Embed This Chart on Your Site
<a href="https://www.geysera.com/blog/email-marketing/2026-email-marketing-benchmarks-by-industry-the-complete-reference-updated-march-2026">
    <img src="https://dliqujzbgyvclfdcjvdm.supabase.co/storage/v1/object/public/media/blog/1777001564666-oxjj0v.png" alt="Email campaigns vs automated flows 2026 — flows generate 17.6x more revenue" width="800">
  </a>
  <p><small>Source: <a href="https://www.geysera.com/blog/email-marketing/2026-email-marketing-benchmarks-by-industry-the-complete-reference-updated-march-2026">2026 Email Marketing Benchmarks</a> by Geysera. Data: Klaviyo (183K+ brands).</small></p>
Table 5: Deliverability Benchmarks
Sources: Validity 2026, Mailchimp, MailerLite
| Metric | Benchmark | Notes |
|---|---|---|
| Email delivery rate | 98.16% | Server acceptance (not inbox) |
| Average inbox placement | 83-85% | 1 in 6 emails never reaches inbox |
| Gmail inbox placement | 53.70% | Down from 58.72% in Q1 2024 |
| Corporate email placement | <51% | B2B severely affected |
| DMARC adoption (top 10M domains) | 18.2% | Shockingly low |
| DMARC enforcement | 7.6% | Even lower |
| Spam complaint max threshold | 0.3% | Google/Yahoo enforcement |
| Spam complaint target | <0.10% | Recommended |
Bounce Rate Benchmarks by Industry
| Industry | Soft Bounce | Hard Bounce |
|---|---|---|
| Daily Deals | 0.06% | 0.28% |
| Religion | 0.08% | 0.33% |
| E-commerce | 0.12% | 0.45% |
| Retail | 0.14% | 0.48% |
| Sports | 0.15% | 0.52% |
| Real Estate | 0.26% | 0.71% |
| Education | 0.23% | 0.80% |
| Telecom | 0.50% | 1.31% |
| Software/Web Apps | 0.49% | 1.37% |
Bounce Rate Targets
| Metric | Safe | Warning | Danger |
|---|---|---|---|
| Hard bounces | <0.3% | 0.3-0.5% | >0.5% |
| Soft bounces | <1% | 1-1.5% | >1.5% |
| Total | <1.5% | 1.5-2% | >2% |
What this means: Deliverability is the foundation. No optimization matters if emails don't arrive. Gmail specifically is getting harder — fewer than 54% of marketing emails reach the primary inbox. Full authentication (SPF, DKIM, DMARC) is table stakes.
For the full deliverability analysis: Email Deliverability in 2026
Table 6: Regional Benchmarks
Source: DotDigital, MailerLite 2025-2026
| Region | Open Rate | CTR | Notes |
|---|---|---|---|
| Oceania | 46.34% | 2.35% | Highest engagement globally |
| Europe | 41.20% | 2.10% | Strong GDPR-compliant engagement |
| North America | 39.80% | 1.95% | Largest market, moderate engagement |
| Latin America | 35.60% | 1.70% | Growing market |
| Asia-Pacific | 19.14% | 1.09% | Lowest — different email culture |
What this means: Regional differences are significant. A 19% open rate for APAC audiences is normal, not a crisis. Send-time optimization by region can lift opens 12-15%. Benchmark against your specific region, not global averages.
Table 7: SMS vs. Email — Head-to-Head
Sources: Omnisend, Sakari, DotDigital
| Metric | SMS | Winner | |
|---|---|---|---|
| Open rate | 90-98% | 28-39% | SMS |
| Click-through rate | 6-35% | 2-3.8% | SMS |
| Conversion rate | 21-30% | 12-15% | SMS |
| Response rate | 45% | ~6% | SMS |
| Time to read | 90% in 3 min | 90 min avg | SMS |
| ROI | $21-71/$1 | $36-42/$1 | Email (consistency) |
| Unsubscribe rate | 1.5-3.5% | 0.08-0.22% | Email (10-15x lower) |
| Frequency tolerance | 1/week | Daily OK |
What this means: SMS dominates on engagement metrics. Email dominates on sustainability and ROI consistency. Combined channel use increases CLV by approximately 30%.
For the full comparison: SMS vs. Email Marketing in 2026
Table 8: AI Impact on Email Metrics
Sources: HubSpot, Litmus, Knak, McKinsey
| AI Application | Measurable Impact |
|---|---|
| Subject line optimization | +22% open rates |
| A/B test optimization (AI) | +49% open rates |
| Send-time optimization | +15-23% open rates |
| 1:1 personalization at scale | +82% conversion rates |
| AI-powered campaigns overall | +41% revenue |
| CTR improvement | +13% |
| Multivariate test accuracy | +22% vs. traditional A/B |
| Inbox placement (AI spam detection) | 94.1% |
| Pre-send prediction accuracy | 81.4% |
| ROI per $1 on AI personalization | $8.70 |
AI Adoption Rates
| Metric | Rate |
|---|---|
| US marketers using gen AI | 70% |
| Using AI for email copy | 34% |
| AI image creation increase (YoY) | 340% |
| Teams needing 2+ weeks per email | 6% (down from 62%) |
What this means: AI improves virtually every metric, with personalization (+82% conversion) and send-time optimization (+15-23% opens) offering the highest returns. But the sameness risk is real — when everyone optimizes with the same AI tools, the advantage commoditizes.
For the full analysis: AI Email Marketing in 2026
Table 9: Mobile vs. Desktop Engagement
Sources: Litmus, Genesys Growth
| Metric | Mobile | Desktop | Webmail |
|---|---|---|---|
| Share of opens | 47-60% | 10-29% | ~29% |
| Average read time | 9.7 sec | 13.2 sec | — |
| Click-through rate | 2.6% | 3.4% | — |
| Median reply time | 28 min | Longer | — |
| Conversion quality | Lower | Higher | — |
Device Preferences by Generation
| Generation | Smartphone Primary |
|---|---|
| Gen Z | 67% |
| Millennials | 59% |
| Gen X | ~45% |
| Boomers | ~30% |
What this means: Mobile captures first engagement; desktop captures conversions. 93% of marketing emails are mobile-optimized, and responsive design increases clicks by 15%. Optimize for mobile viewing but ensure the conversion path works on desktop.
Table 10: Best Send Times
Sources: MailerLite, Omnisend 2025-2026
By Day of Week
| Day | Open Rate | Click Rate |
|---|---|---|
| Friday | 49.72% | 8.09% |
| Monday | 49.44% | 7.20% |
| Tuesday | 49.30% | 7.84% |
| Wednesday | 48.90% | 7.60% |
| Thursday | 48.50% | 7.40% |
| Saturday | ~45% | ~5.80% |
| Sunday | ~44.80% | ~5.50% |
By Time of Day
| Time Window | Best For | Why |
|---|---|---|
| 8-11 AM | Opens | Morning inbox clearing |
| 10 AM | All-around reliability | Peak professional attention |
| 3-4 PM | Clicks | Afternoon decision-making |
| 8-9 PM | Conversions | Evening shopping behavior |
| Friday 6 PM | High-value campaigns | Weekend spending mindset |
What this means: Friday leads on both opens and clicks, but midweek differences (Tue-Thu) are small enough to be noise. The 8 PM time slot showed a surprise 59% open rate. AI send-time optimization (+15-23%) outperforms any fixed schedule.
How to Use These Benchmarks
Do
- Compare to your own historical data first — your trend matters more than industry averages
- Benchmark by email type — compare flows to flow benchmarks, campaigns to campaign benchmarks
- Track quarter-over-quarter movement — improving or declining matters more than absolute numbers
- Segment by audience — B2B vs. B2C, new vs. established, high-value vs. standard
- Use as starting baselines — then set targets based on your specific program
Don't
- Use open rates as absolute performance targets — MPP inflates them 15-20 points
- Compare campaign CTR to flow CTR — they're fundamentally different (3.3x gap)
- Benchmark a DTC brand against SaaS averages — industry context matters enormously
- Trust single-source data — cross-reference across Klaviyo, MailerLite, Omnisend, etc.
- Ignore the gap between reported and real — bot clicks, dark opens, and attribution inflation all widen it
Why Benchmarks Can Be Misleading
The Gap Between Reported and Real
- MPP inflation: Open rates sit 15-20 points higher than reality
- Bot clicks: Security scanners and AI crawlers inflate CTR — 3M+ bot clicks/day at peak
- Attribution inflation: Last-click gives email 100% credit for multi-touch journeys
- Survivorship bias: Benchmark reports use data from ESP customers — brands that invest in email, not the full market
- Average vs. distribution: The "average" hides enormous variance — top 10% perform 9-18x better than average
The right mindset: benchmarks are the floor, not the ceiling. Use them to identify whether you're drastically underperforming. Then set targets based on your own historical improvement trajectory.
Related: Are Email Open Rates Dead? | Email Attribution Is Broken
Methodology
Data Sources and Collection
| Source | Sample Size | Time Period |
|---|---|---|
| Klaviyo | 183,000+ brands | 2025-2026 |
| MailerLite | 3.6M campaigns, 181,000+ accounts | 2025-2026 |
| Omnisend | Ecommerce merchants | 2024-2025 |
| GetResponse | Customer base | 2025 |
| Mailchimp | Enterprise and SMB | 2025 |
| Validity | Deliverability monitoring | 2025-2026 |
| DotDigital | Global campaigns | 2025-2026 |
All benchmark data is aggregated across each platform's customer base. Differences between sources reflect different customer compositions (e.g., Klaviyo skews ecommerce; MailerLite skews SMB/creator). Cross-referencing multiple sources provides a more complete picture than relying on any single report.
Frequently Asked Questions
What is a good email open rate by industry in 2026?
It varies enormously: Religion (55.71%), Hobbies (53.25%), and Non-profit (52.38%) lead, while Travel (30.10%), Publishing (34.24%), and Computers/Electronics (35.29%) trail. All numbers are inflated by Apple MPP — subtract 15-20 points for estimated real engagement.
What is the average email CTR by industry?
The all-industry average is 1.7-2.1% for campaigns. Legal (4.90%), Manufacturing (4.22%), and Media (4.10%) lead. E-commerce (1.07%), Beauty (0.95%), and Politics (0.83%) trail. Automated flows average 5.58% — always compare flows to flow benchmarks.
How do email benchmarks differ by region?
Oceania leads globally (46.34% open rate, 2.35% CTR). Europe (41.20%, 2.10%), North America (39.80%, 1.95%), and Latin America (35.60%, 1.70%) follow. Asia-Pacific trails significantly (19.14%, 1.09%) due to different email culture and platform usage patterns.
How much better are automated flows than campaigns?
Flows outperform campaigns on every metric: 1.3x open rate, 3.3x CTR, 13.2x conversion rate, 17.6x RPR. Flows generate 37% of email revenue from just 2% of send volume.
How often are these benchmarks updated?
This reference page is updated quarterly with fresh data from our primary sources. Last update: April 2026.
Related guides
- What is a good email open rate in 2026?
- Browse abandonment emails: the complete strategy guide
- Abandoned cart email: the ultimate recovery guide
Sources
- Klaviyo 2026 Email Marketing Benchmarks (183,000+ brands)
- MailerLite 2025-2026 Benchmarks (3.6M campaigns, 181,000+ accounts)
- Omnisend 2025-2026 Ecommerce Marketing Report
- GetResponse Email Marketing Benchmarks
- Mailchimp Email Marketing Benchmarks
- Validity 2026 Deliverability Benchmark Report
- DotDigital Global Benchmark Report 2026
- Litmus State of Email Reports 2025-2026
- HubSpot Email Marketing Statistics 2026
Published by Geysera | March 2026 | Updated quarterly
2026 Email Marketing Benchmarks — Full Series
- The Email Metrics Framework Nobody Uses (But Should)
- Open Rates Are Lying to You
- Click-Through Rates: The Metric That Actually Matters
- Revenue Per Recipient: The Only Email Metric Your CFO Cares About
- Email Deliverability: The Numbers Behind Whether Your Emails Actually Arrive
- Automation vs. Campaigns: The Data Behind the 17x Revenue Gap
- SMS vs. Email Marketing: What the Metrics Actually Say
- Email Attribution Is Broken
- AI Email Marketing in 2026
- The email metrics that actually matter in 2026
- 2026 Email Marketing Benchmarks by Industry: The Complete Reference (you are here)

Co-Founder and CEO
Bob Thordarson is CEO and Co-Founder of Geysera, a serial entrepreneur with 25+ years and five co-founded ventures, including Cequint (acquired by TNS in 2010 for $112.5M) and Consumerware (acquired by ParkerVision). A graduate of the University of Washington and MIT Entrepreneurial Masters Program, based in Seattle, he serves on the boards of DRY Soda Co. and the Entrepreneurs' Organization Seattle chapter. He is an expert in retention marketing email systems and methodology for ecommerce and B2B brands — measured by incremental revenue, not vanity metrics.