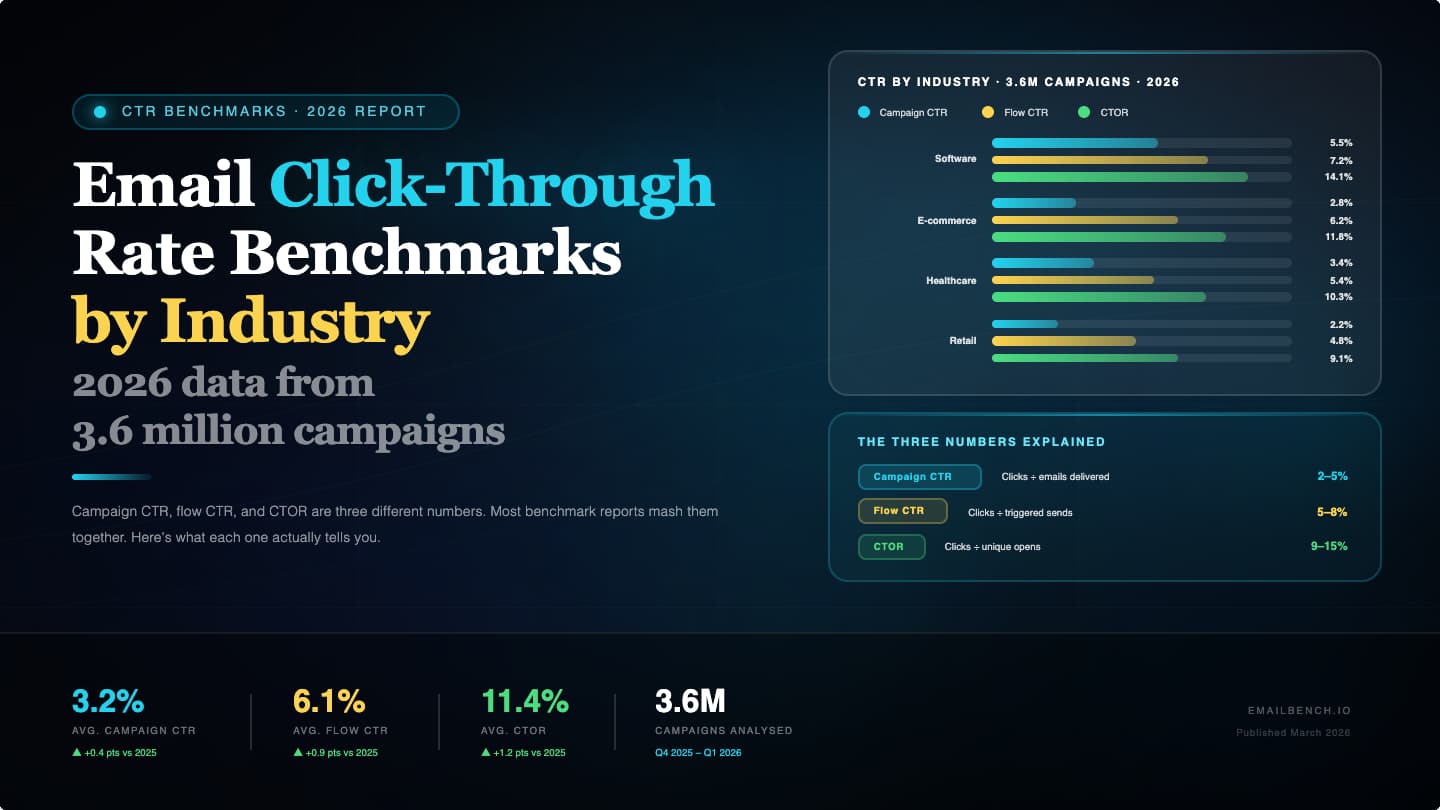
Email click-through rate benchmarks by industry: 2026 data from 3.6 million campaigns
"Opens can be faked but clicks can't" — wrong. Enterprise security tools pre-click every link. Real 2026 CTR benchmarks from 3.6M campaigns, with bot contamination rates and how to filter them.
Key benchmarks at a glance
| Metric | Figures |
|---|---|
| Campaign CTR (all industries) | 1.7-2.1% average (MailerLite 2.09%, Klaviyo 1.69%). |
| Campaign CTR by industry | Legal 4.90%, Manufacturing 4.22%, and Media 4.10% lead. |
| Automated flow CTR | 5.58% — 3.3x higher than campaigns; top 10% reach 10.48%. By sector: Sporting Goods 6.13%, Food & Beverage 5.90%, Clothing & Accessories 5.40%, Health & Beauty 4.80%. |
| CTR by email type | GetResponse: newsletters 3.84%, triggered/automated 5.02%, image-based 4.84%, text-based 1.64%. |
| Click-to-open rate (CTOR) | 6.81% — 2026 average; MPP-inflated opens drag it down artificially. |
| Non-human (bot) click rate | M3AAWG: 20-80% of B2B clicks non-human; up to 10% in B2C. |
Campaign CTR, flow CTR, and CTOR are three different numbers. Most benchmark reports mash them together. Here's what each one actually tells you.
Part 3 of 11 in the 2026 Email Marketing Benchmarks series. Previous: Open Rates ← | Next: Revenue Per Email →
Key takeaways
- Campaign CTR averages 1.7-2.1% across all industries; automated flows hit 5.58% (3.3x higher)
- Legal (4.90%), Manufacturing (4.22%), and Media (4.10%) lead campaign CTR
- Image-based emails get 4.84% CTR vs. 1.64% for text-based emails
- Click-to-open rate (CTOR) averages 6.81%, up from 5.63% in 2024
- CTR is the primary engagement metric for 29% of email professionals
- Bot clicks contaminate 20-80% of B2B click data; even B2C sees up to 10% non-human clicks
There's a popular line in email marketing: "Opens can be faked by Apple's privacy bots, but clicks can't." It was a comforting idea. It's also wrong.
Clicks are harder to fake than opens, sure. But enterprise security software from Microsoft Defender, Proofpoint, Mimecast, and Barracuda pre-clicks every link in incoming emails to scan for malware before a human ever sees the message. According to M3AAWG research, 20-80% of B2B email clicks are non-human. Even in B2C, the rate runs up to 10%. CTR is still a better engagement signal than open rate, but it's not the clean metric people treat it as.
The average campaign CTR sits at 1.7-2.1% depending on who's counting. Automated flows average 5.58%. Those are wildly different numbers, and mixing them up will wreck your benchmarking. And both numbers may include phantom clicks from security bots that nobody filtered out.
This post is part 3 of 11 of our 2026 Email Marketing Benchmarks series.
What counts as a good email CTR right now?
Campaign CTR by industry
All-industry average: 2.09% (MailerLite) | 1.69% (Klaviyo)
| Industry | CTR | vs. Average |
|---|---|---|
| Legal | 4.90% | +134% |
| Manufacturing | 4.22% | +102% |
| Media | 4.10% | +96% |
| Construction | 3.53% | +69% |
| Hobbies | 3.30% | +58% |
| Government | 3.05% | +46% |
| Blogger | 3.00% | +44% |
| Religion | 2.95% | +41% |
| Non-profit | 2.90% | +39% |
| Retail | 1.27% | -39% |
| Sports | 1.27% | -39% |
| Software & Web App | 1.15% | -45% |
| E-commerce | 1.07% | -49% |
| Restaurants | 1.06% | -49% |
| Beauty & Personal Care | 0.95% | -55% |
| Politics | 0.83% | -60% |
| All Industries Average | 2.09% | Baseline |
Source: MailerLite 2025-2026, 3.6M campaigns, 181,000+ accounts
Legal and Manufacturing sit at the top because their emails contain things people need to act on: contract updates, compliance deadlines, quote requests, spec sheets. There's a reason to click. Beauty and e-commerce emails tend to be visual and browse-oriented. People window-shop in the email itself without ever clicking through.
GetResponse adds useful context
| Email Type | CTR |
|---|---|
| All industries average | 3.25% |
| Newsletters | 3.84% |
| Triggered/automated | 5.02% |
| Image-based emails | 4.84% |
| Text-based emails | 1.64% |
Image-based emails get 3x the CTR of text-based. That's a bigger gap than most people expect.
Campaign CTR vs. flow CTR: stop combining these
Most benchmark reports lump campaign and flow CTR together. This makes the numbers useless.
Klaviyo 2026 flow click rates
| Flow Type / Sector | Average Flow CTR | Top 10% CTR |
|---|---|---|
| All Flows | 5.58% | 10.48% |
| Sporting Goods | 6.13% | — |
| Food & Beverage | 5.90% | — |
| Clothing & Accessories | 5.40% | — |
| Health & Beauty | 4.80% | — |
Flows get 3.3x higher CTR than campaigns. The reason is simple: they fire when someone just did something. Abandoned a cart, browsed a product, signed up. The intent is already there.
If you're comparing your abandoned cart flow (which should be at 5%+) against a campaign benchmark of 2%, you're measuring the wrong thing.
CTR ranges by email type
| Email Type | Below Average | Average | Good | Excellent |
|---|---|---|---|---|
| Broadcast campaigns | <1% | 1-2% | 2-4% | >4% |
| Automated flows | <3% | 3-5% | 5-8% | >8% |
| Welcome series | <4% | 4-7% | 7-12% | >12% |
| Abandoned cart | <5% | 5-8% | 8-15% | >15% |
| Win-back | <1% | 1-3% | 3-5% | >5% |
| Post-purchase | <2% | 2-4% | 4-7% | >7% |
A 3% CTR on an abandoned cart flow isn't "above the campaign average." It's below average for its type. Benchmark against the right category or the number means nothing.
Click-to-open rate (CTOR): what it tells you and where it breaks
How CTOR works
CTOR = (Unique Clicks / Unique Opens) x 100
CTR tells you what percentage of everyone you emailed clicked. CTOR tells you what percentage of people who actually opened clicked. It isolates content quality from deliverability and subject line performance.
2026 CTOR benchmarks
Overall average: 6.81% (up from 5.63% in 2024)
| Industry | CTOR | What's going on |
|---|---|---|
| Manufacturing | 14.82% | Actionable B2B content |
| Legal | 14.72% | High-stakes, click-demanding |
| Media | 12.92% | Curiosity-driven |
| Construction | 12.38% | Bid/quote-oriented |
| Higher Education | 9.15% | Application deadlines |
| Non-profit | 8.24% | Donation CTAs |
| Hobbies | 8.45% | Passion engagement |
| E-commerce | 4.01% | Visual browsing, low click intent |
| Beauty & Personal Care | 3.91% | Aspirational browsing |
| Insurance | 3.19% | Low urgency |
| Politics | 2.96% | Outrage opens, low action |
Source: MailerLite 2025-2026
The catch with CTOR
CTOR depends on opens. And opens are inflated by Apple Mail Privacy Protection. If MPP registers 1,000 "opens" but only 600 people actually opened, your CTOR denominator is 67% too high. Your content looks less compelling than it is.
If your ESP has MPP exclusion filters, use them before looking at CTOR. And treat CTOR as a relative signal between your own campaigns rather than a way to benchmark against industry numbers. The industry numbers are all corrupted by the same problem.
Related: Are Email Open Rates Dead in 2026?
What actually moves CTR higher
The biggest lever is the one most teams ignore: build more automated flows. The 5.58% vs 1.7-2.1% gap is enormous, and if you're still sending mostly campaigns, that's the first thing to fix.
After that, use images (4.84% vs 1.64% CTR, per GetResponse), stick to one CTA per email (35% of marketers rate clear CTAs as the most effective element, and choice paralysis is real), and segment by behavior so content matches what someone just did.
Related: Why Automated Flows Generate 18x More Revenue | Revenue Per Email: The Metric That Matters
The bot click problem: your CTR might be lying to you
Open rates got their credibility crisis when Apple MPP launched. CTR is going through its own version now, quieter but just as real.
How it works
Enterprise email security tools (Microsoft Defender, Proofpoint, Mimecast, Barracuda, Cisco) scan inbound emails by clicking every link before delivering the message. The ESP's tracking pixel registers a "click." No human was involved. Jay Schwedelson recommends a simple detection test: send an email at 3 AM and check for clicks in the first 30 minutes. Real humans don't click emails at 3:17 AM, two seconds after delivery.
Another trick from Schwedelson: add a hidden link (white text on white background) as a bot trap. Bots click everything including invisible links. Humans don't.
How bad is it?
M3AAWG (the Messaging, Malware and Mobile Anti-Abuse Working Group) studied non-human interaction rates across the industry. Their findings:
- B2B: 20-80% of recorded clicks are non-human. Enterprise-grade security software is more aggressive with link scanning, and B2B lists skew heavily toward corporate inboxes protected by these tools.
- B2C: up to 10% non-human clicks, less for well-established senders with strong reputation.
- AI bots peaked at 3+ million clicks per day in early 2025, as crawlers tied to AI tools (ChatGPT, ClaudeBot) started following links in email bodies.
If your B2B abandoned cart flow is showing a 15% CTR, a meaningful chunk of that might be Proofpoint.
Does your ESP filter bot clicks?
Not all of them do.
| ESP | Bot click filtering | Notes |
|---|---|---|
| ActiveCampaign | Yes (BotSense) | AI/ML pattern recognition. Pro and Enterprise plans. Filters reports but not automation triggers. |
| Klaviyo | Yes (partial) | Filters in reporting and attribution. Custom reports available for bot click tracking. |
| GetResponse | Yes (Bot Detector) | Filters bot traffic from both reports and automation triggers. |
| HubSpot | Yes | Toggle in marketing email analytics. |
| Braze | Yes | Built-in bot identification tools. |
| Marketo (Adobe) | Yes | Bot Activity Filtering in admin settings. |
| MailerLite | No | No bot click or MPP filtering. Reported metrics may be inflated. |
| Omnisend | No | No bot click filtering as of March 2026. |
This matters more than it looks. If you're on MailerLite and your competitor benchmarks against Klaviyo's filtered data, you're comparing inflated numbers to cleaned ones. The "industry averages" in this article come from MailerLite's 3.6M campaign dataset, which does not filter bot clicks. Take them as directional, not absolute.
What to do about it
Check whether your ESP filters bot clicks. If it does, turn it on. If it doesn't, look at conversion rate or revenue per email instead of raw CTR. A click that converts is a human click. A click that bounces in 0.3 seconds from a datacenter IP is not.
If you're evaluating ESPs and bot click filtering isn't on your checklist, add it. This problem is getting worse, not better.
The zero-click problem
Zero-click searches now account for 69% of Google queries (Similarweb, July 2025). The same thing is happening in email. The newsletters with the highest retention and paid conversion rates? They deliver the full value inside the email. No click required.
Val Geisler (former Klaviyo advisor, now Chief Email Officer at Fix My Churn) has been arguing for years that the email itself should be the destination. In a zero-click world, measuring success by CTR penalizes your best content.
The beehiiv numbers tell the story: 28 billion emails sent, 41%+ average open rates, $19M in paid subscriptions in 2025 (up 138% from 2024). Substack crossed 8.4M paid subscribers, $510M+ annualized. People pay for newsletters they read inside their inbox. They never click out.
When to use CTR vs. something else
| Email Type | Primary Metric | Why |
|---|---|---|
| Promotional campaigns | CTR then Conversion | Action-oriented, click-to-buy |
| Abandoned cart flows | CTR then RPR | Recovery = clicks that convert |
| Welcome series | CTR + Conversion | First-impression engagement |
| Newsletters | Read time + Retention | Value delivered in-email |
| Relationship/nurture | Reply rate + Retention | Conversation quality |
| Win-back | CTR + Reactivation rate | Re-engagement signal |
Frequently Asked Questions
What's a good email CTR in 2026?
For campaigns, 2-4% is good, above 4% is excellent. For automated flows, 5-8% is good, above 8% is excellent. The all-industry campaign average is 1.7-2.1%. Flows average 5.58%.
Why is my email CTR low?
Common causes: you're sending mostly broadcast campaigns instead of behavior-triggered flows, your emails are text-heavy (image-based emails get 3x higher CTR), your CTAs are unclear or competing with each other, you're emailing unengaged segments, or your ESP recently started filtering bot clicks and the "real" number was always this low.
What's the difference between CTOR and CTR?
CTOR measures clicks as a percentage of opens: (Unique Clicks / Unique Opens) x 100. It isolates content quality among people who opened. CTR measures clicks against everyone who received the email. CTOR averages 6.81% in 2026, but MPP-inflated opens drag the number down artificially.
Do image-based emails actually get higher click rates?
Yes. GetResponse data shows 4.84% CTR for image-based emails vs. 1.64% for text-based. That said, this varies by industry. B2B and technical content may not see the same lift.
Are bot clicks inflating my email CTR?
Probably, especially if you send to B2B lists. M3AAWG research found that 20-80% of B2B clicks are non-human, generated by security tools like Microsoft Defender and Proofpoint scanning links before delivery. B2C rates are lower (up to 10%) but still meaningful. Check whether your ESP filters bot clicks. If it doesn't, treat conversion rate as your real engagement metric.
Why do automated flows get higher CTR than campaigns?
Because they fire when someone just did something relevant: abandoned a cart, browsed a product, signed up. The content matches a recent action, so the intent is already there. That behavioral targeting produces 3.3x higher CTR on average.
Sources
- MailerLite 2025-2026 Benchmark Report (3.6M campaigns, 181,000+ accounts)
- Klaviyo 2026 Email Marketing Benchmarks (183,000+ brands)
- GetResponse Email Marketing Benchmarks
- Omnisend 2025-2026 Ecommerce Marketing Report
- beehiiv State of Newsletters 2026
- M3AAWG Non-Human Interaction (NHI) Research
- Validity, "Are These Clicks for Real? The Rise of Bot Clicks" (January 2026)
- Braze, "Bot or Not: Understanding Email Bot Clicks"
- Jay Schwedelson, SubjectLine.com
- Val Geisler, Fix My Churn
2026 Email Marketing Benchmarks — Full Series
- The Email Metrics Framework Nobody Uses (But Should)
- Open Rates Are Lying to You
- Click-Through Rates: The Metric That Actually Matters (you are here)
- Revenue Per Recipient: The Only Email Metric Your CFO Cares About
- Email Deliverability: The Numbers Behind Whether Your Emails Actually Arrive
- Automation vs. Campaigns: The Data Behind the 17x Revenue Gap
- SMS vs. Email Marketing: What the Metrics Actually Say
- Email Attribution Is Broken
- AI Email Marketing in 2026
- The email metrics that actually matter in 2026
- 2026 Email Marketing Benchmarks by Industry: The Complete Reference

Co-Founder and CEO
Bob Thordarson is CEO and Co-Founder of Geysera, a serial entrepreneur with 25+ years and five co-founded ventures, including Cequint (acquired by TNS in 2010 for $112.5M) and Consumerware (acquired by ParkerVision). A graduate of the University of Washington and MIT Entrepreneurial Masters Program, based in Seattle, he serves on the boards of DRY Soda Co. and the Entrepreneurs' Organization Seattle chapter. He is an expert in retention marketing email systems and methodology for ecommerce and B2B brands — measured by incremental revenue, not vanity metrics.