Revenue Per Recipient (RPR) 2026 Benchmarks: $1.94 vs $0.11
Automated flows earn $1.94 per recipient. Campaigns earn $0.11. That is an 18x gap, and it comes from 183,000+ Klaviyo stores. Most email teams spend their week optimizing campaigns while flows quietly generate the real revenue. RPR benchmarks by channel, by industry, and by percentile — plus why your conversion rate is misleading without AOV context.
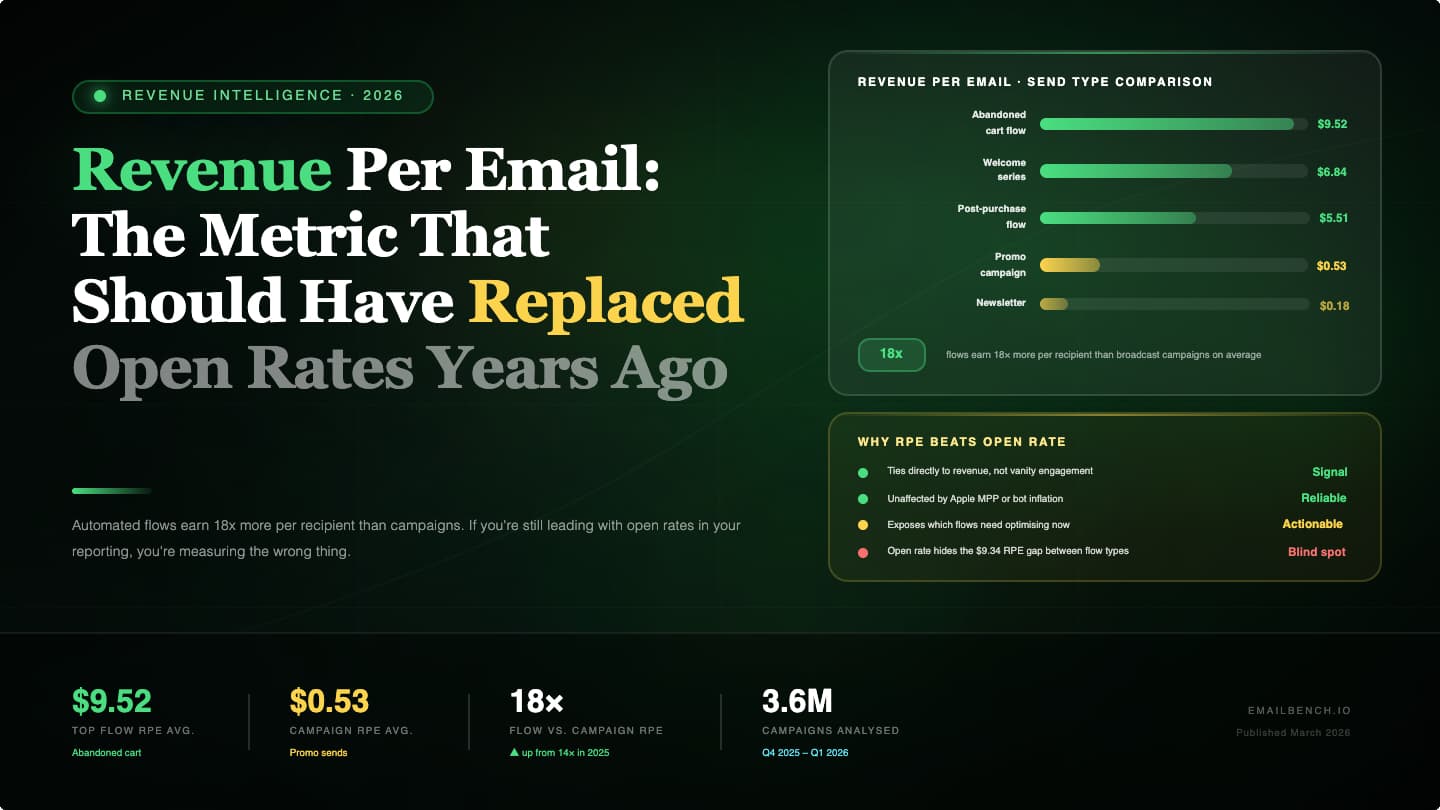
Automated flows earn 18x more per recipient than campaigns. If you're still leading with open rates in your reporting, you're measuring the wrong thing.
Part 4 of 11 in the 2026 Email Marketing Benchmarks series. Previous: CTR Benchmarks ← | Next: Deliverability →
Key takeaways
- Automated flows earn $1.94 per recipient vs. $0.11 for campaigns — an 18x gap
- Abandoned cart flows average $3.65 RPR; the top 10% hit $28.89
- Scholastic increased revenue per thousand emails by 150% by sending fewer emails with better targeting
- Click-to-conversion rate hit 9% in 2025, up 53% year-over-year
- The 13x conversion gap between flows (2.11%) and campaigns (0.16%) should change how you spend your time
There's a question I keep coming back to when I look at email dashboards: why is the number everyone reports first — open rate — the one with the weakest connection to money?
Revenue Per Recipient (RPR) tells you how many dollars each person on your list generates when you email them. Automated flows produce $1.94 per recipient. Campaigns produce $0.11. That's not a rounding error. That's a completely different business model hiding inside the same channel.
Most email teams spend the bulk of their week on campaigns and treat flows as set-it-and-forget-it. The revenue data says that ratio is backwards.
This post is part 4 of 11 of our 2026 Email Marketing Benchmarks series.
What is RPR (revenue per recipient)?
Revenue Per Recipient (RPR) is the average dollar amount generated per person who received an email. If you send a campaign to 9,000 people and it drives $1,000 in revenue, your RPR is $0.11.
The formula:
RPR = Total Revenue / Total Recipients
Recipients means everyone the email was delivered to, not just people who opened or clicked. That distinction matters. Open rate tells you about subject lines. Click-through rate tells you about email content. RPR tells you whether the whole chain worked, from inbox to checkout.
Klaviyo, Omnisend, and Drip all report RPR at the campaign level and the flow level. The difference between those two numbers is wild. Across 183,000+ Klaviyo stores, campaigns average $0.11 per recipient. Flows average $1.94. That is an 18x gap, and it is the reason most email revenue comes from automated sequences, not one-off sends.
If your campaign RPR is below $0.11, you are below the 50th percentile. If your flow RPR is above $1.94, you are beating most stores on the platform. The table below breaks this down by channel and percentile.
How RPR is actually calculated (flows vs campaigns)
Most articles treat RPR like a simple formula. It is not. The denominator changes depending on whether you are looking at a campaign, a single flow email, or an entire flow — and that changes the number dramatically.
The formula everyone quotes
RPR = Revenue / Deliveries
Deliveries means emails that landed in an inbox. Not unique people. Not sends. Deliveries. If 100 emails bounced out of 10,000 sends, your denominator is 9,900.
For a single campaign email, deliveries and unique recipients are basically the same number. You send one email to one person. But for flows, they diverge fast.
Campaign RPR: straightforward
You send a Black Friday campaign to 15,000 subscribers. It generates $1,800 in attributed revenue within the 5-day attribution window.
Campaign RPR = $1,800 / 15,000 deliveries = $0.12
One email, one delivery per person. Simple.
Flow RPR: the denominator problem
You run a 5-email abandoned cart flow. This month, 2,000 people enter the flow. Not everyone makes it to email 5 — some buy after email 1, some unsubscribe, some hit the exit condition.
| Flow email | Recipients | Revenue attributed |
|---|---|---|
| Email 1 (1 hour after abandonment) | 2,000 | $4,200 |
| Email 2 (24 hours) | 1,600 | $2,080 |
| Email 3 (48 hours, includes 10% off) | 1,200 | $3,600 |
| Email 4 (72 hours) | 900 | $810 |
| Email 5 (7 days, final reminder) | 700 | $350 |
| Totals | 6,400 deliveries | $11,040 revenue |
Three different RPR numbers come out of this:
Per-email RPR (what Klaviyo shows on each flow email):
- Email 1: $4,200 / 2,000 = $2.10
- Email 2: $2,080 / 1,600 = $1.30
- Email 3: $3,600 / 1,200 = $3.00
- Email 4: $810 / 900 = $0.90
- Email 5: $350 / 700 = $0.50
Flow-level RPR (total flow revenue / total flow deliveries): $11,040 / 6,400 = $1.73
Per unique recipient (what most people think RPR means): $11,040 / 2,000 unique people = $5.52
Three different numbers from the same flow. The Klaviyo benchmark of $1.94 for flows uses the per-email calculation, not the per-person number. So when you compare your flow RPR against that $1.94 figure, make sure you are comparing the same thing.
Why shorter flows can report higher RPR
Take the same 2,000 people but run a 3-email flow instead of 5:
| Flow email | Recipients | Revenue attributed |
|---|---|---|
| Email 1 (1 hour) | 2,000 | $4,200 |
| Email 2 (24 hours) | 1,600 | $2,080 |
| Email 3 (48 hours, 10% off) | 1,200 | $3,600 |
| Totals | 4,800 deliveries | $9,880 revenue |
Flow-level RPR = $9,880 / 4,800 = $2.06
You dropped two emails, lost $1,160 in revenue, but the RPR went up from $1.73 to $2.06. That is because emails 4 and 5 were dragging the average down — they had low revenue per delivery ($0.90 and $0.50) while adding 1,600 deliveries to the denominator.
This is exactly why RPR alone does not tell you whether to add or remove emails from a flow. A 5-email flow earning $11,040 is better than a 3-email flow earning $9,880, even though the 3-email flow has higher RPR. Total revenue still matters.
RPR vs RPE: what is the actual difference?
People use these interchangeably. They should not.
RPE (Revenue Per Email) = Total revenue / Total emails delivered. This is the same calculation as RPR in practice. Klaviyo, Omnisend, and most platforms use deliveries as the denominator for both terms.
RPR (Revenue Per Recipient) = Total revenue / Unique recipients. Technically, RPR should divide by unique people, not total emails sent. A recipient who gets 5 flow emails is still one recipient.
In practice, almost every platform (including Klaviyo) calculates what they call "RPR" using deliveries, not unique recipients. So Klaviyo's "Revenue Per Recipient" is actually Revenue Per Email Delivered. The name is misleading.
Same flow, two metrics:
| Metric | Formula | Result |
|---|---|---|
| RPE (revenue per email delivered) | $11,040 / 6,400 deliveries | $1.73 |
| True RPR (revenue per unique recipient) | $11,040 / 2,000 people | $5.52 |
When you see the $1.94 Klaviyo benchmark for flows, that is RPE — revenue per delivery. The true per-person number is much higher, typically 3-5x depending on how many emails your flow sends.
How attribution works within a flow
Klaviyo uses last-touch attribution with a 5-day window. When a recipient opens Email 1 on Monday, opens Email 3 on Wednesday, and buys on Thursday, the revenue goes to Email 3. It was the last email interacted with before the purchase.
This means:
- Only one email in the flow gets credit for each purchase
- Earlier emails that warmed the customer up get $0 in attributed revenue
- The first email in a flow almost always has the highest RPR because it catches the easy conversions — people who were going to buy anyway
- Later emails have lower RPR but still contribute incremental revenue that would not exist without them
The attribution model rewards the closer, not the opener. Email 1 might have done 80% of the persuasion work, but if the customer opens Email 3 before buying, Email 3 gets 100% of the credit.
The definitions, quickly
Revenue Per Email (RPE): Total revenue generated divided by emails delivered.
Revenue Per Recipient (RPR): Total revenue generated divided by unique recipients. More precise than RPE because it counts people, not messages. This is the standard Klaviyo uses across 183,000+ brands.
RPME (Revenue Per 1,000 Emails Delivered): RPE times 1,000. Useful for larger programs where per-email numbers like $0.003 feel meaningless.
RPR and RPE get used interchangeably in most industry conversations. RPR is technically better. Use whichever your platform reports.
How to calculate your RPR
Start with one campaign or one flow. Not your entire account.
Example — Campaign RPR: You send a spring sale email to 12,000 subscribers. Klaviyo attributes $1,440 in revenue to that send. Your campaign RPR is $1,440 / 12,000 = $0.12. That is slightly above the $0.11 median. Not bad for a single campaign.
Example — Flow RPR: Your abandoned cart flow sends 800 emails this month and drives $2,160 in attributed revenue. Flow RPR = $2,160 / 800 = $2.70. That is above the $1.94 median and approaching the top 25%.
Where to find RPR in your platform:
- Klaviyo: Campaign detail page, scroll to "Revenue per recipient" (or Dashboard, Performance tab)
- Omnisend: Campaign reports, "Revenue per email" (same metric, different label)
- Mailchimp: Not natively shown. Calculate manually: E-Commerce Revenue / Recipients from the campaign report.
One thing to watch: Klaviyo calculates RPR using a 5-day default attribution window. A customer who buys 4 days after your email still counts. This inflates RPR compared to platforms with shorter windows. When comparing benchmarks across platforms, check the attribution window first.
2026 RPR benchmarks (Klaviyo, 183,000+ brands)
Campaign RPR
| Sector | Average RPR | Top 10% RPR |
|---|---|---|
| Overall | $0.11 | $0.97 |
| Food & Beverage | $0.16 | — |
| Automotive | $0.16 | — |
| Clothing & Accessories | $0.12 | — |
| Health & Beauty | $0.10 | — |
Automated flow RPR
| Flow Type | Average RPR | Top 10% RPR |
|---|---|---|
| All Flows | $1.94 | $16.96 |
| Abandoned Cart | $3.65 | $28.89 |
| Welcome Series | $2.65 | $21.18 |
| Browse Abandonment | $1.50 | $12.30 |
| Post-Purchase | $0.85 | $7.40 |
| Win-Back | $0.65 | $5.80 |
The 18x gap
Flows earn 17.6x higher RPR than campaigns. Omnisend's data confirms the pattern from a different angle: $2.87 per automated email vs. $0.18 per campaign.
This one data point should change how you allocate your time. If 80% of your email team's week goes to campaigns and 20% goes to automation, the ratio is inverted relative to where the money actually comes from.
Related: Email automation vs. campaigns: why flows generate 18x more revenue
RPR benchmarks by industry
RPR varies by what you sell. A $200 skincare order produces different per-recipient numbers than a $15 grocery subscription. These ranges come from the Klaviyo 2025-2026 dataset and represent the 25th-75th percentile for stores with 10,000+ subscribers.
| Industry | Campaign RPR | Flow RPR | Top 10% Flow RPR |
|---|---|---|---|
| Fashion & Apparel | $0.12-$0.20 | $2.00-$3.50 | $5.80+ |
| Health & Beauty | $0.10-$0.18 | $1.80-$3.00 | $5.20+ |
| Home & Garden | $0.09-$0.14 | $1.20-$2.20 | $3.50+ |
| Food & Beverage | $0.06-$0.10 | $1.00-$1.80 | $2.80+ |
| Electronics | $0.05-$0.08 | $0.80-$1.50 | $2.40+ |
| Subscription / DTC | $0.08-$0.12 | $0.60-$1.20 | $2.00+ |
Fashion and beauty lead because AOV is high and people buy on impulse. Electronics RPR is lower because nobody buys a laptop from one email. Subscription businesses look weak on per-email RPR but make it up on lifetime value, so this table only tells part of their story.
Compare your RPR to your own vertical, not the overall average. A $0.08 campaign RPR is normal in food and beverage. In fashion, that same number puts you in the bottom quartile.
Conversion rates: where revenue actually starts
Conversion by email type
| Email Type | Conversion Rate | Why |
|---|---|---|
| Abandoned cart | 10.7% | Highest intent — already had items in checkout |
| Back-in-stock | 6.46% | Product desire plus scarcity |
| Post-purchase follow-up | 6.8% | Trust already established |
| Welcome series | ~3% | First impression, often discount-driven |
| Broadcast campaigns | 0.16% | Bulk send, mixed intent |
The 13x campaign-to-flow conversion gap
| Type | Average placed order rate | Top 10% |
|---|---|---|
| Campaigns | 0.16% | 0.36% |
| Automated Flows | 2.11% | 4.30% |
That's a 13.2x difference. Pair it with higher RPR and the picture is clear: flows generate most of the email revenue from a fraction of the send volume.
Click-to-conversion rate
Overall: 9% in 2025, up 53% year-over-year from 5.9% in 2024 (Omnisend).
Highest converting industries:
- Games: 15.1%
- Food & Drink: 14.9%
- Health: 14.8%
One in three automated email clickers makes a purchase. For welcome and abandoned cart flows, it's closer to one in two.
B2C vs. B2B
| Segment | Conversion Rate |
|---|---|
| B2C | 2.8% |
| B2B | 2.4% |
Source: HubSpot
The birthday email outlier
Birthday emails produce an average order value of $744.37 — roughly 4x higher than normal promotional emails. It's one of the highest-converting, highest-AOV automated flows you can run, and most brands either don't have one or haven't touched theirs in years.
The RPME framework: Jeanne Jennings' approach
Jeanne Jennings (founder of Email Optimization Shop, adjunct professor at Georgetown) has been pushing RPME as the primary email success metric for years. Her formula:
RPME = (Total Revenue / Emails Delivered) x 1,000
The per-thousand framing matters. If your program sends millions of emails, a per-email number like $0.003 is psychologically invisible. Multiply by a thousand and it becomes $3 — a number people actually react to in meetings.
The Scholastic case study
Jennings' clearest proof point: Scholastic achieved a 150% increase in quarterly RPME through two changes that most email teams would resist:
- They reduced send volume by 10% per quarter, cutting the lowest-value segments.
- They implemented list modeling with touch limits, moving from 1 email per day to 2 per week.
Fewer emails. Better targeting. Dramatically more revenue per email.
This runs directly against the instinct that more sends equals more revenue. Mathematically, what happens when you add low-value sends is that you dilute the denominator. Revenue doesn't grow proportionally, so RPME drops even if total revenue stays flat or edges up slightly. Scholastic figured out that cutting the bottom of the list was worth more than the marginal revenue those sends produced.
How to implement RPME tracking
- Pull total email-attributed revenue and total emails delivered for a period (monthly or quarterly).
- Calculate RPME: (Revenue / Delivered) x 1,000.
- Track the trend quarter over quarter. Rising RPME means your program is getting more efficient. Declining RPME means you're adding volume without proportional revenue.
- Segment by email type: campaigns vs. flows, promotional vs. content, new subscriber vs. established.
- Set starting benchmarks using Klaviyo data: campaign RPME around $110 per thousand, flow RPME around $1,940 per thousand.
Why conversion rate without AOV context is misleading
Thomas Lalas (fractional director of retention, author of Retention Economics, nearly 20 years as a DTC operator) makes a point that gets overlooked constantly: conversion rate alone tells you nothing about revenue quality.
A 10% conversion rate on $15 products generates $1.50 per converter. A 3% conversion rate on $200 products generates $6.00 per converter. Four times the value at one-third the conversion rate.
This is exactly why RPR works better as a primary metric. It captures both conversion and order value in one number. You stop optimizing for clicks that don't translate to meaningful revenue.
The attribution honesty problem
What Alex Greifeld says everyone's ignoring
Alex Greifeld (author of the "No Best Practices" newsletter, ecommerce operator since 2011) regularly challenges email revenue claims, and her argument deserves more airtime than it gets.
Email platforms are incentivized to attribute maximum revenue to email because that's what justifies the subscription cost. When Klaviyo reports a flow "generated" $50,000, how much of that was truly incremental? How much would have happened anyway?
Think about it concretely. A customer abandons checkout, gets a reminder email, and buys 12 hours later. Was the email the reason? Maybe. Or maybe they were always going to come back. You genuinely can't tell from the attribution data alone.
None of this means stop measuring RPR. It means pair it with incrementality testing. Hold back a percentage of qualified recipients from a flow, compare their purchase rate to the group that got the email. The gap is your real incremental impact. Most brands don't do this because the answer might be uncomfortable.
Related: Email attribution is broken: why your revenue numbers are lying
Ecommerce revenue benchmarks
Annual revenue per subscriber
Average: $6.86 per subscriber per year (Omnisend).
By revenue source
| Source | Revenue per email |
|---|---|
| Automated emails | $2.87 |
| Campaign emails | $0.18 |
Top-performing flows by revenue
- Abandoned cart: Highest RPR across all flow types.
- Welcome series: Second-highest, and according to Jennings, the most undervalued flow in most programs. Can triple RPME compared to routine campaigns.
- Back-in-stock: High conversion plus urgency makes for strong RPR.
- Birthday: Highest AOV at $744.37.
Frequently asked questions
What is Revenue Per Email (RPE)?
RPE measures the dollar value generated per email delivered. Formula: Total Revenue / Emails Delivered. Revenue Per Recipient (RPR) is similar but divides by unique recipients instead. In 2026, campaign RPR averages $0.11 while automated flow RPR averages $1.94.
What is a good RPR for email marketing?
For campaigns: $0.11 is average, $0.97+ is top 10%. For flows: $1.94 is average, $16.96+ is top 10%. Abandoned cart flows should be at $3.65 or higher.
How did Scholastic increase email revenue by sending fewer emails?
They cut volume 10% per quarter and capped frequency at 2 emails per week (down from daily). The low-value sends they eliminated weren't generating enough revenue to justify the denominator bloat. RPME went up 150%.
Should I prioritize conversion rate or revenue per email?
RPR, because it captures both conversion and order value. A 3% conversion rate on $200 products beats a 10% rate on $15 products. Track conversion rate too, but RPR should drive decisions.
How much revenue do abandoned cart emails generate?
$3.65 RPR on average, $28.89 for the top 10%. They convert at 10.7%. About half of clickers buy.
What is revenue per recipient?
Revenue per recipient (RPR) is total email revenue divided by total recipients. It tells you how much money each person on your list generated when you emailed them. The median across 183,000+ Klaviyo stores is $0.11 for campaigns and $1.94 for automated flows. Unlike open rate or CTR, RPR captures the full funnel from inbox to checkout in one number.
What is a good revenue per recipient for Klaviyo?
Depends on whether you are looking at campaigns or flows. For campaigns, $0.11 is the 50th percentile and $0.95 is the top 10%. For flows, $1.94 is median and $16.96 is the top 10%. Most people are surprised by the flow numbers. An abandoned cart flow hitting $2-3 RPR is solid. Below $1.00 means something in the flow is broken or the audience is too broad.
How do you calculate revenue per recipient?
Total revenue attributed to an email divided by total recipients. If you send to 10,000 people and make $1,200, that is $0.12 RPR. One thing people get wrong: do not use your account-wide RPR. It mixes flows and campaigns together and the average is meaningless. Look at each campaign and each flow separately. In Klaviyo, you will find RPR on the campaign detail page. One catch: Klaviyo uses a 5-day attribution window by default, so someone who buys 4 days after your email still counts toward that email's RPR.
Sources
- Klaviyo 2026 Email Marketing Benchmarks (183,000+ brands)
- Omnisend 2025-2026 Ecommerce Marketing Report
- HubSpot Email Marketing Statistics 2026
- Jeanne Jennings, emailopshop.com (RPME framework, Scholastic case study)
- Thomas Lalas, theartofecomm.com
- Alex Greifeld, nobestpractices.co
2026 Email Marketing Benchmarks — Full Series
- The Email Metrics Framework Nobody Uses (But Should)
- Open Rates Are Lying to You
- Click-Through Rates: The Metric That Actually Matters
- Revenue Per Recipient: The Only Email Metric Your CFO Cares About (you are here)
- Email Deliverability: The Numbers Behind Whether Your Emails Actually Arrive
- Automation vs. Campaigns: The Data Behind the 17x Revenue Gap
- SMS vs. Email Marketing: What the Metrics Actually Say
- Email Attribution Is Broken
- AI Email Marketing in 2026
- The email metrics that actually matter in 2026
- 2026 Email Marketing Benchmarks by Industry: The Complete Reference

Co-Founder and CEO
Bob Thordarson is CEO of Geysera. A 5x founder with two exits and an MIT Entrepreneurial Master's grad, he is an expert in retention marketing email systems and methodology for ecommerce and B2B brands — measured by incremental revenue, not vanity metrics.