Are Email Open Rates Dead in 2026? What Apple MPP, Gmail Proxy, and Bot Opens Mean for Your Data
The most widely reported email metric is now the least reliable. Here's how broken it actually is.
Half your email opens are machines, not people. Apple MPP, dark clicks, and AI bots have broken the metric. Here's what to measure instead.
Part 2 of 11 in the 2026 Email Marketing Benchmarks series. Previous: Benchmarks Overview ← | Next: CTR Benchmarks →
The short version
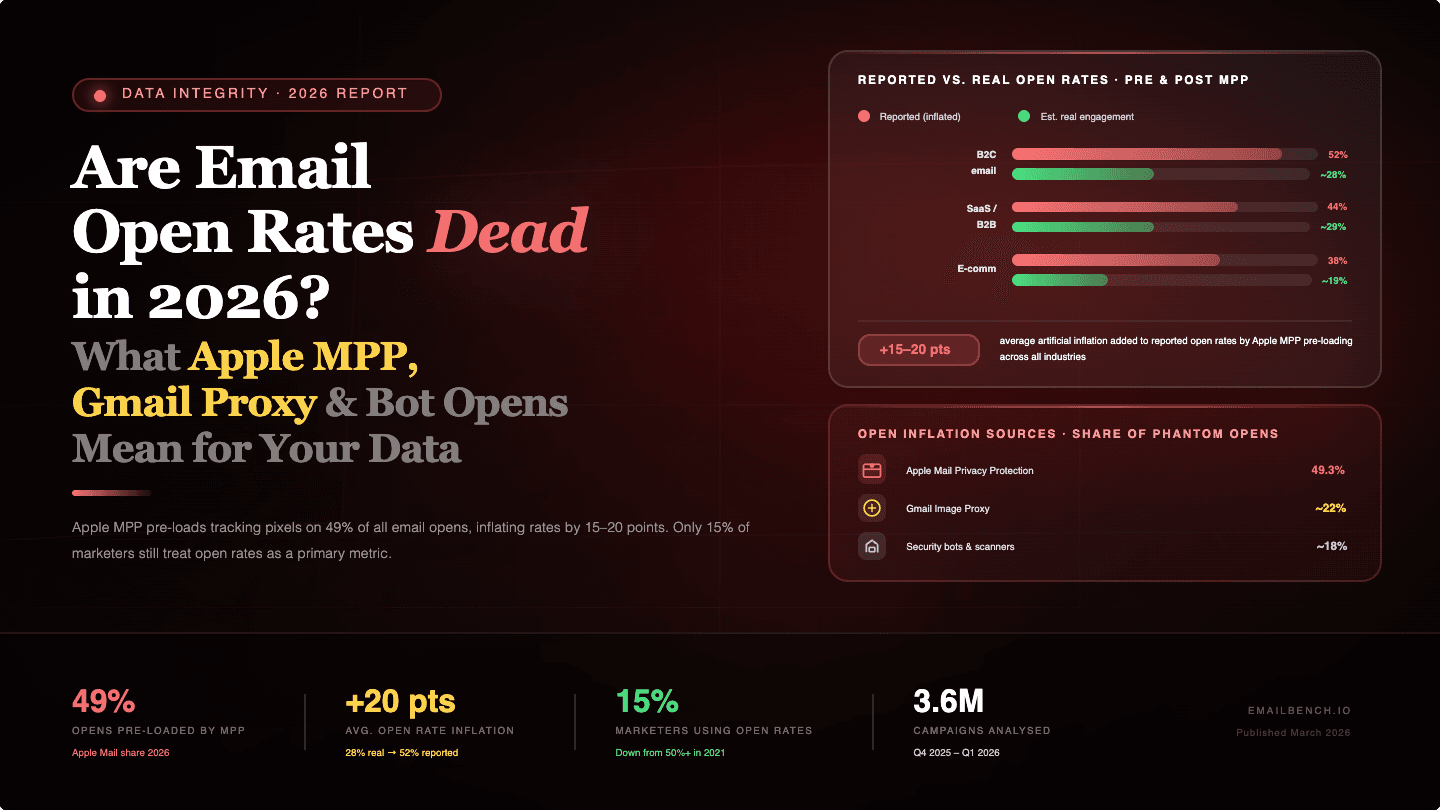
- Apple Mail Privacy Protection accounts for 49% of email opens and inflates rates by 15-20+ points.
- Only 15% of email marketers still treat open rates as a primary success metric.
- Three kinds of phantom engagement — dark opens, dark clicks, and AI bot crawling — are corrupting your data in ways most dashboards don't show you.
- AI bot clicks peaked at 3+ million per day in early 2025.
- Open rates are still useful for exactly two things: deliverability monitoring and trend analysis. That's it.
If you ran an email campaign last week and your ESP showed a 44% open rate, roughly half of those "opens" were machines. Not people. Machines.
Apple Mail Privacy Protection is active on 49.29% of all email opens. It pre-loads tracking pixels, whether or not anyone reads the email. Gmail, Yahoo, and Microsoft do similar things. So when your dashboard says 42-44% open rate, the actual number of humans who read your email is... lower. Probably a lot lower.
But the inflated opens are honestly the least of your problems. Underneath, phantom engagement is corrupting your click data, your segmentation, and your automated workflows in ways that are harder to see and more expensive to ignore.
This post is part 2 of 11 of our 2026 Email Marketing Benchmarks series.
How Apple Mail Privacy Protection broke open rates
What MPP does
Apple launched MPP in September 2021. The mechanics are simple and devastating for email tracking:
- An email arrives in someone's Apple Mail inbox.
- Apple's servers immediately download all images and tracking pixels via proxy.
- Your ESP registers an "open."
- The subscriber may never look at the email.
That's it. Every email delivered to Apple Mail gets counted as opened.
How big is the distortion?
| Metric | Data point |
|---|---|
| Apple Mail share of email opens | 49.29% (January 2025) |
| B2C subscribers on MPP-capable Apple Mail | ~64% |
| Open rate inflation | 15-20+ percentage points |
| Pre-MPP target open rate | 25-30% |
| Post-MPP reported open rate | 40-45% (no actual engagement change) |
To put that concretely: campaigns that tracked ~28% open rates before MPP now show ~52% open rates, with identical click rates and conversions. Nothing changed except the number on your dashboard.
It's not just Apple
Gmail introduced image proxy technology years ago, which obscures IP addresses, device types, and geolocation. Gmail holds 72.1% of global mailbox usage.
Yahoo and Microsoft have adopted similar pre-fetching. Microsoft began rejecting non-compliant messages as of May 2025, and all three providers enforce strict authentication for senders exceeding 5,000 daily emails.
Between them, these providers cover nearly every consumer inbox. Open tracking is compromised across the board.
What the benchmarks actually show (with caveats)
Open rates are unreliable as absolute measures. But relative differences across industries still carry some signal:
| Industry | Reported open rate | Reality check |
|---|---|---|
| Religion | 55.71% | Genuine passion + heavy MPP inflation |
| Hobbies | 53.25% | Self-selected, engaged audiences |
| Non-profit | 52.38% | Mission-driven engagement |
| Government | 48.52% | Compliance/mandatory reads |
| Health & Fitness | 47.81% | High personal relevance |
| E-commerce | 44.78% | Heavily inflated by MPP |
| Business & Finance | 43.34% | Mixed B2B/B2C |
| Retail | 37.47% | Volume senders, lower engagement |
| Marketing & Advertising | 37.23% | Industry fatigue |
| Computers & Electronics | 35.29% | Tech-savvy, more MPP-aware |
| Travel & Transportation | 30.10% | Seasonal, high churn |
Source: MailerLite 2025-2026, 3.6M campaigns
Religion consistently outperforms Travel regardless of MPP inflation. That relative gap is real. But using any of these numbers as absolute performance targets is a mistake.
Phantom engagement is corrupting more than just opens
Open rate inflation gets the most attention, but it's actually the least dangerous problem. Three categories of non-human activity are distorting your entire engagement picture.
Dark opens (image prefetching)
Email clients automatically download images and tracking pixels before, or without, any human interaction. Apple MPP is the biggest offender, but Gmail does it selectively, and Yahoo and Microsoft have joined in.
This isn't just a vanity metric problem. If you segment on "engaged subscribers who opened in 30 days," you're now including people who never read your email. If you trigger automations on opens, those are firing on phantom engagement. In Apple-heavy audience segments, up to 75% of reported opens may be artificial.
Dark clicks (security scanning)
This one should worry you more than dark opens.
Every major mailbox provider now scans links in emails before the human recipient sees them:
| Provider | Feature | What it does |
|---|---|---|
| Gmail | Click-time link protections | Pre-clicks links to scan for malware |
| Outlook | Safe Links | Automatically follows all links in emails |
| Yahoo | Security scanning | Pre-scans link destinations |
These security measures click your links automatically. That inflates CTR, corrupts engagement scoring, and triggers automated journeys based on "engagement" that never happened.
Think about what that means in practice. Your "winning" A/B test variant might just be the one bots prefer. Abandoned cart emails fire for people who never abandoned anything. Your lead scoring model marks subscribers as "highly engaged" who never actually opened an email. And here's the one that really stings: bots click unsubscribe links too, silently removing real subscribers who wanted to stay on your list.
AI bot crawling
This is the newest problem. In early 2025, user agent strings tied to AI tools like ChatGPT and ClaudeBot started showing up in email click tracking. By mid-March 2025, this peaked at more than 3 million bot clicks in a single day across monitored platforms.
Organizations sending to security-sensitive domains (businesses, government, education) get hit hardest, since those domains deploy more aggressive link scanning.
Detecting and filtering bot activity
The best email operations teams use a combination of these methods:
| Method | How it works | What it catches |
|---|---|---|
| Time-to-action analysis | Flag actions occurring in <1 second | Machine-speed clicks and opens |
| Hidden link honeypots | Embed invisible links (white-on-white, single-pixel) humans wouldn't see | Definitive bot identification |
| User agent filtering | Filter known bot user agents from reporting | AI crawlers, security scanners |
| HTTPS enforcement | Use HTTPS for all links | Reduces aggressive pre-scanning |
| Code confirmation | Use numerical codes instead of click-to-confirm | Prevents bot opt-in confirmations |
One thing worth noting: as of December 2025, major ESPs have begun automatically filtering known bot clicks. If your CTR dropped slightly in late 2025, that's probably a good sign. The number is lower but more honest.
What should replace open rates?
What the experts say
Chad White (Group VP CRM Strategy at Zeta Global, author of Email Marketing Rules) calls open rates "health metrics, not success metrics." They signal deliverability problems when they drop suddenly, but they can't tell you whether anyone is actually engaged.
Jeanne Jennings (founder of Email Optimization Shop, 20+ years in email) is more blunt about using open rates for A/B tests, segmentation, or campaign comparisons: "That ship has sailed."
Only 15% of email marketers still rely on open rates as a primary success measure, according to Litmus's 2025 report.
What to track instead
| Metric | Why it's better | Benchmark |
|---|---|---|
| Click-through rate | Requires intentional human action | Campaigns: 1.7-2.1%; Flows: 5.58% |
| Click-to-open rate (filtered) | Content relevance signal (filter MPP first) | Average: 6.81% |
| Revenue per recipient | Direct connection to revenue | Campaigns: $0.11; Flows: $1.94 |
| Click-to-conversion rate | End-to-end efficiency | 9% (up 53% YoY) |
For deeper dives on each:
- Email CTR benchmarks by industry
- Revenue per email: the replacement metric
- The email metrics framework for 2026
- What is a good email open rate in 2026?
When open rates are still useful
Open rates still do two things well. Exactly two.
Deliverability monitoring. If your open rate drops 10+ points suddenly, something is wrong with inbox placement. You don't need the number to be accurate in absolute terms to notice a cliff.
Relative comparison. Two campaigns to similar audiences on the same day? The difference between them probably reflects a real subject line effect, since both are equally inflated by the same bots and proxies.
That's the whole list. Open rates can't reliably compare campaigns to different audiences, can't serve as A/B test metrics, can't power segmentation, can't trigger automations, and can't benchmark against industry averages. Five years ago, they could do all of those things. They can't now.
Common questions
Are open rates accurate at all anymore? Not as a measure of engagement. Apple MPP pre-loads tracking pixels on 49% of opens regardless of whether anyone reads the email. Gmail, Yahoo, and Microsoft do similar things. What you're measuring is delivery and device behavior, not people reading.
How inflated are the numbers? MPP alone adds 15-20 percentage points in Apple-heavy audiences. A campaign that tracked 28% pre-MPP now reports 52% with zero change in actual engagement.
What are "dark clicks"? Security scanners at Gmail, Outlook, and Yahoo that automatically click links in your emails to check for malware. Your ESP records these as real clicks. They're not.
Can I filter out bot activity? Yes. Flag clicks under 1 second (no human is that fast), use hidden honeypot links that only bots would click, filter known bot user agents, and enforce HTTPS. Most ESPs now do some of this automatically.
What should I track instead? Click-through rate for engagement. Revenue per recipient for business impact. Jennings's Unsubscribe-to-Click Rate for list health. See the metrics framework post for the full picture.
Sources
- Litmus State of Email 2025
- MailerLite 2025-2026 Benchmark Report (3.6M campaigns)
- Klaviyo 2026 Benchmarks (183,000+ brands)
- beehiiv Apple MPP Impact Analysis
- Braze: "Bot or Not: Understanding Email Bot Clicks"
- StoneShot: "Battling Bots: Rise of the Machines"
- Iterable: "Email Opens and Clicks: Human or Not"
- Chad White, emailmarketingrules.com
- Jeanne Jennings, emailopshop.com
2026 Email Marketing Benchmarks — Full Series
- The Email Metrics Framework Nobody Uses (But Should)
- Open Rates Are Lying to You (you are here)
- Click-Through Rates: The Metric That Actually Matters
- Revenue Per Recipient: The Only Email Metric Your CFO Cares About
- Email Deliverability: The Numbers Behind Whether Your Emails Actually Arrive
- Automation vs. Campaigns: The Data Behind the 17x Revenue Gap
- SMS vs. Email Marketing: What the Metrics Actually Say
- Email Attribution Is Broken
- AI Email Marketing in 2026
- The email metrics that actually matter in 2026
- 2026 Email Marketing Benchmarks by Industry: The Complete Reference
Related guides:
- What is a good email open rate in 2026?
- Browse abandonment emails: the complete strategy guide
- Abandoned cart email: the ultimate recovery guide

Co-Founder and CEO
Bob Thordarson is CEO and Co-Founder of Geysera, a serial entrepreneur with 25+ years and five co-founded ventures, including Cequint (acquired by TNS in 2010 for $112.5M) and Consumerware (acquired by ParkerVision). A graduate of the University of Washington and MIT Entrepreneurial Masters Program, based in Seattle, he serves on the boards of DRY Soda Co. and the Entrepreneurs' Organization Seattle chapter. He is an expert in retention marketing email systems and methodology for ecommerce and B2B brands — measured by incremental revenue, not vanity metrics.