What is a good email open rate in 2026?
Mailchimp says the average open rate is 19%. MailerLite says 43%. Both are measuring 2026. The gap exists because Apple Mail Privacy Protection broke open rate tracking in 2021, and most benchmarks still don't account for it. This guide pulls data from 6 major platforms and 34 email experts to give you real benchmarks by industry, email type, and list size, plus 12 tactics to improve your numbers.
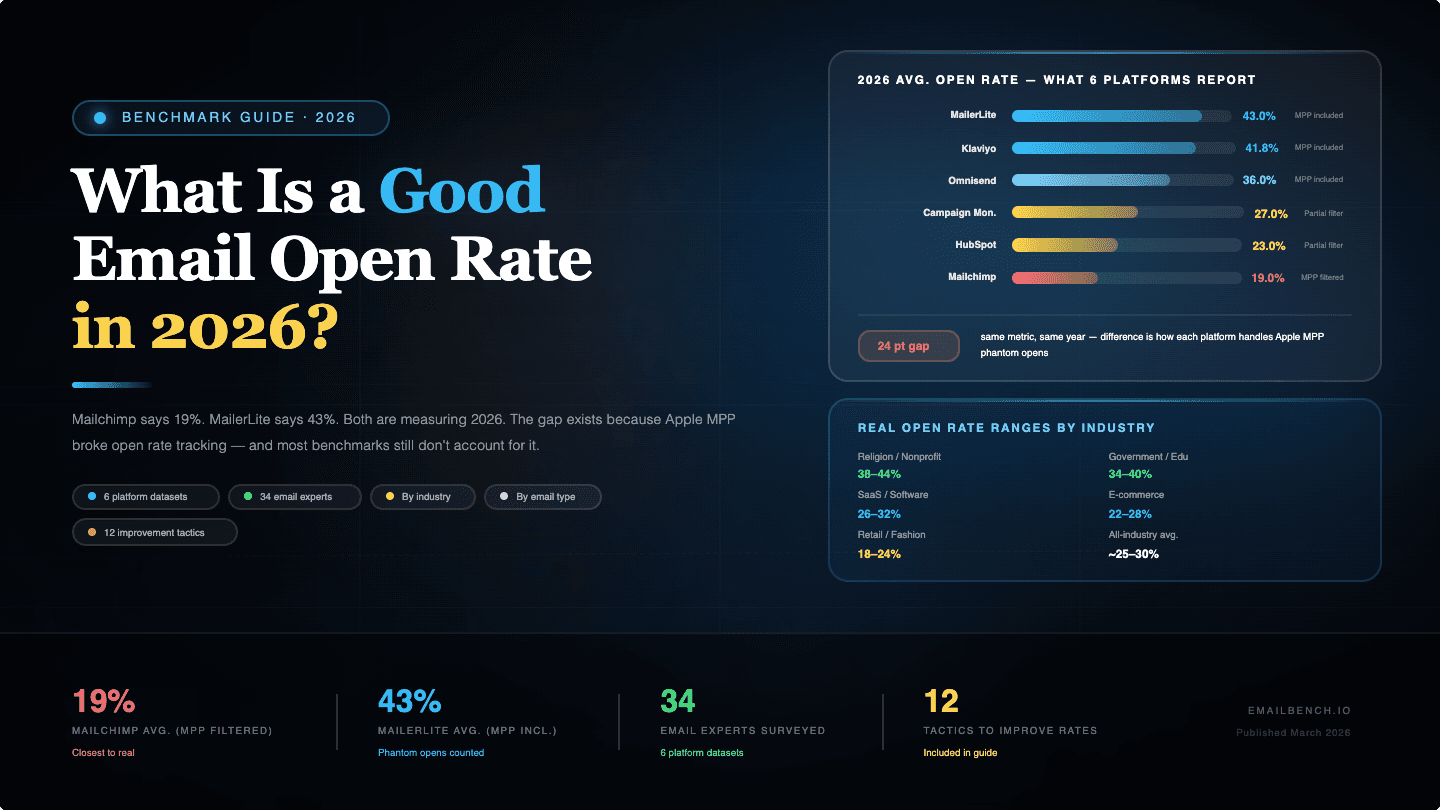
The average email open rate in 2026 is somewhere between 19% and 44%.
That is not a typo. The gap depends entirely on who is measuring, what they are measuring, and whether they are filtering out machine-generated opens from Apple Mail Privacy Protection. Mailchimp reports 19.21% after stripping out fake opens. MailerLite reports 43.46% without that filter. Same year, same industry, wildly different numbers.
So when someone asks "what is a good email open rate?" the honest answer is: it depends on how you are counting.
This guide breaks down the real benchmarks for 2026 across industries, email types, and list sizes. It explains why open rates have become harder to trust, what "good" actually means for your specific situation, and 12 ways to improve your numbers based on what the best email marketers in the world are actually doing right now.
In this guide:
- What email open rate actually measures (and why it broke in 2021)
- Average open rates by industry, email type, list size, B2B vs B2C
- How to figure out if your open rate is good, bad, or meaningless
- How to calculate your open rate
- 7 common reasons open rates tank
- 12 tactics to fix it, sourced from deliverability specialists, subject line researchers, and email strategists
What is email open rate?
Email open rate is the percentage of delivered emails that recipients open. The formula:
Open rate = (unique opens / delivered emails) x 100
If you send 10,000 emails, 9,800 get delivered (200 bounce), and 2,450 people open, your open rate is 25%.
The way ESPs track this is simple. They embed a tiny invisible image (a tracking pixel) in each email. When the email renders and the pixel loads, that counts as an open. This method has been the standard for over 20 years.
It worked well enough until September 2021.
The Apple Mail Privacy Protection problem
When Apple launched Mail Privacy Protection (MPP) in iOS 15, it broke open rate tracking for roughly half of all email recipients.
The mechanism: when an Apple Mail user has "Protect Mail activity" enabled, Apple's servers pre-fetch all email content, including tracking pixels, before the user ever sees the message. This registers an "open" even when the subscriber never looked at the email.
The numbers tell the story:
- Apple Mail accounts for 49-54% of all email opens (Litmus, January 2025)
- Around 95% of Apple Mail users have MPP turned on (Chad White, Zeta Global)
- Open rates jumped 18 percentage points within six months of MPP launching
- One newsletter reported its open rate jumped from 28% to 55% overnight with zero change in actual engagement
Chad White, who has spent two decades as a researcher at Zeta Global, Oracle, Salesforce, and Litmus, recommends using a "proxy audience" approach: identify subscribers who are not on Apple Mail and use that segment's open rate as your true engagement benchmark. It is not perfect, but it is the most reliable workaround available.
The bottom line: a "good" open rate in 2026 depends on whether you are looking at raw numbers (which include MPP inflation) or adjusted numbers. This guide provides both.
How to calculate email open rate
The formula is simple:
Email open rate = (unique opens / emails delivered) x 100
A few things to get right:
- Use delivered emails as the denominator, not emails sent. Delivered = sent minus bounces.
- Use unique opens, not total opens. If one subscriber opens the same email three times, that counts as one unique open.
- Most ESPs calculate this automatically in your campaign dashboard.
Example: You send 5,000 emails. 4,850 are delivered (150 bounced). 1,067 unique subscribers open. Your open rate is 1,067 / 4,850 = 22%.
What about MPP-adjusted open rate? Some ESPs (Mailchimp, for example) try to filter out machine opens from Apple Mail Privacy Protection. If yours does, your reported open rate will be lower but more accurate. If it does not, your rate will be higher but inflated. Neither is wrong. Just know which one you are looking at.
To estimate your "true" open rate manually: segment your list to exclude Apple Mail users and check the open rate on that non-Apple segment. That is roughly what your real engagement looks like across the full list. Chad White at Zeta Global calls this the "proxy audience" method.
Average email open rate in 2026
Every major email platform publishes benchmark data, and none of them agree. That is partly methodology, partly the types of senders on each platform, and partly how each handles Apple MPP.
The major platforms report wildly different numbers:
| Source | Average open rate | Notes |
|---|---|---|
| Mailchimp (MPP-adjusted) | 19.21% | Filters machine opens |
| Campaign Monitor | 25-30% | Conservative methodology |
| Omnisend (ecommerce) | 30.70% | Up from 26.6% in 2024 |
| Klaviyo (ecommerce) | 31% campaigns / 44.8% flows | 183K+ brands |
| Mailchimp (all opens) | 35.63% | Includes MPP |
| GetResponse | 39.64% | Includes MPP |
| ActiveCampaign | 39.26% | Includes transactional |
| MailerLite | 43.46% | 3.6M campaigns, includes MPP |
If your ESP filters machine opens, 20-25% is average. If it does not, 30-40% is average. Neither number is wrong. They are measuring different things.
Quick answer: The average email open rate in 2026 is 20-25% (MPP-adjusted) or 30-44% (raw). If you are between those ranges, you are normal. The tables below will help you find the benchmark for your specific industry and email type.
Email open rate by industry (2026 benchmarks)
Your industry matters more than you probably think. A 30% open rate in ecommerce retail is above average. A 30% open rate for a nonprofit is below average.
These are 2026 benchmarks from multiple sources, sorted highest to lowest. Where platforms disagree, the range is shown.
| Industry | Open rate range | Notes |
|---|---|---|
| Religion / Spirituality | 55-56% | Consistently the highest across platforms |
| Hobbies / Leisure | 40-53% | Passionate audiences, high engagement |
| Nonprofits | 40-54% | Mission-driven content performs well |
| Government / Politics | 38-49% | Varies by election cycles |
| Education | 35-48% | Schools, online courses, training |
| Arts / Entertainment | 38-51% | Strong creative communities |
| Health / Fitness | 35-48% | Broad range depending on niche |
| Coaching / Consulting | 39-48% | B2B and B2C mixed |
| Legal services | 47% | Small, engaged lists typical |
| B2B services | 37-43% | Professional audiences |
| Real estate | 31-43% | Highly regional |
| SaaS / Software | 36-39% | Product-focused sends |
| Ecommerce / Retail | 30-45% | Wide range by sub-vertical |
| Financial services | 34-38% | Compliance-heavy, but trusted |
| Publishing / Media | 32-43% | Newsletter fatigue is real |
| Restaurants / Food | 38-39% | Local and loyalty-driven |
| Travel | 30-41% | Seasonal swings |
| Marketing / Advertising | 29-37% | Irony: marketers are bad at opening marketing emails |
| Telecommunications | 28% | Lowest across most platforms |
Source data: MailerLite (3.6M campaigns), Klaviyo (183K+ brands), GetResponse, Mailchimp, ActiveCampaign, Moosend. For a deeper breakdown by vertical, see our email marketing benchmarks by industry 2026 guide.
If you are in ecommerce and your campaign open rate is 31%, you are right at the Klaviyo median. The top 10% of Klaviyo accounts hit 45.1%.
Open rate by email type
Not all emails are created equal. Welcome emails and abandoned cart emails will always outperform your Tuesday newsletter blast, and that is fine. They should. The subscriber just did something, and the email is a direct response to that action.
| Email type | Average open rate |
|---|---|
| Welcome emails | 68-83% |
| Back-in-stock alerts | 58-65% |
| Shipping confirmations | 63% |
| Post-purchase / review requests | 60-70% |
| Abandoned cart emails | 39-50% |
| Browse abandonment | 35-45% |
| Win-back / re-engagement | 29% |
| Newsletters | 22-40% |
| Promotional campaigns | 15-32% |
The gap between automated emails and campaigns is enormous. Klaviyo data shows automated flows average 44.8% open rates while campaigns average 24.8%. Flows generate 41% of total email revenue from just 5.3% of sends (Klaviyo, 2026). We break this down further in our guide to email automation vs campaigns performance.
This is not a small difference. If you are spending most of your email effort on campaign blasts and barely touching your automations, you are leaving money and engagement on the table.
For ecommerce brands: Automated flows like abandoned cart, welcome, and post-purchase emails are where the real open rates (and revenue) live. Geysera helps ecommerce brands build and optimize these flows to maximize engagement and recover lost revenue.
Open rate by list size
Smaller lists almost always have higher open rates. This is normal, and it does not mean your engagement is bad if you have a large list. It means you have a large list.
| List size | Typical open rate |
|---|---|
| Under 1,000 | 30-40% |
| 1,000-5,000 | 25-30% |
| 5,000-25,000 | 20-25% |
| 25,000-100,000 | 18-22% |
| 100,000+ | 15-20% |
The reason is straightforward: smaller lists skew toward recent, engaged subscribers. Larger lists accumulate disengaged subscribers over time. This does not mean large lists are unhealthy. It means list hygiene matters more as you scale (more on that in the tactics section).
B2B vs B2C open rates
B2B emails tend to have higher open rates than B2C (36-43% vs ~38%), but the click behavior differs.
B2B subscribers open because they are researching, comparing, or solving a work problem. B2C subscribers open (or don't) faster, and when they click, it is usually to buy something immediately.
The other difference: B2C audiences have a higher proportion of Apple Mail users, which means B2C open rates are more inflated by MPP. A B2C brand seeing 40% open rates should be more skeptical of that number than a B2B SaaS company seeing the same.
Best days and times to send
The short answer: weekday mornings between 8-11 AM in the recipient's local timezone.
The longer answer: it barely matters compared to other factors. MailerLite data shows open rate differences between the best and worst days are only about 1-2 percentage points. The difference between a good subject line and a bad one can be 10+ points.
That said, here is what the data shows:
- Monday through Thursday mornings (8-11 AM) produce the highest open rates
- Friday at 6 PM is the strongest combined open+click alignment (49.7% opens per MailerLite)
- Weekend sends see 3-5% lower open rates on average
- Sending once per week yields 48.31% open rates vs 41.34% at three times per week (MailerLite)
The real move here is not picking the "best" day. It is using AI-powered send time optimization (STO) to deliver at each subscriber's individual best time. Klaviyo reports 8-12% open rate lift from per-subscriber STO versus fixed-time sends.
What is a "good" email open rate? (It depends)
Benchmarks are useful for context. They are terrible as targets.
A "good" email open rate is one that is (a) accurately measured, (b) trending in the right direction, and (c) better than your own recent past. The industry average is a reference point, not a goal.
The three-tier framework
A rough guide, split by measurement methodology:
| Rating | MPP-adjusted rate | Raw / reported rate |
|---|---|---|
| Below average | Under 17% | Under 30% |
| Average | 17-25% | 30-40% |
| Above average | 25%+ | 40%+ |
Context that shifts what "good" means
Your open rate does not exist in a vacuum. These factors change what you should expect:
Your industry. A 35% open rate in telecom is excellent. The same number for a nonprofit is middling. Use the industry table above.
Your email type. Automated flows will always outperform campaigns. Do not compare your newsletter open rate to your welcome email open rate. They are different animals.
Your list size. A 500-person list with 40% open rates is not comparable to a 100,000-person list with 22%. Both can be healthy.
Your acquisition source. Subscribers who found you through organic search or referrals open at 30-45% in their first 90 days. Subscribers acquired through paid Facebook lead ads open at 15-25%. If you grew fast through paid channels, expect lower rates.
Your measurement tool. Some ESPs filter MPP. Others do not. Comparing your Mailchimp (MPP-adjusted) rate to a Klaviyo benchmark (not adjusted) is comparing different metrics.
The benchmark that actually matters
Dela Quist, founder of Alchemy Worx and an email strategist who has analyzed 25 billion emails through his Touchstone platform, argues that per-campaign open rates are the wrong thing to watch anyway.
His recommendation: track "open reach" instead. That is the number of unique subscribers who opened any email over a 30- or 90-day period, not the open rate of individual sends. A subscriber who opens one email out of eight is still engaged. Per-campaign metrics would call them disengaged. Open reach catches the full picture.
Tim Watson of Zettasphere takes this further, arguing that email open rate "is as useful as your appendix." His point: it measures pixel loads, not attention. A subscriber who opens an email for half a second and closes it registers the same as someone who reads every word.
The most useful approach: compare your own open rate month-over-month. A declining trend is the signal that something is wrong, whether the absolute number is 20% or 45%.
What is a good open rate for email blasts?
Depends on what you mean by "blast."
If you are sending one email to your entire list with no segmentation, no behavioral trigger, and no personalization — the kind of send most marketers mean when they say "email blast" — expect 15-25% open rates on an MPP-adjusted basis, or 25-35% raw.
That is lower than automated flows, and it should be. Blasts are untargeted by nature. The subscriber did not do anything to trigger the email. You just decided it was Tuesday and hit send.
| Blast type | Open rate range | Notes |
|---|---|---|
| Promotional blast (sale, discount) | 15-25% | Highest volume, lowest engagement |
| Content / educational blast | 20-30% | Performs better when genuinely useful |
| Announcement (product launch, news) | 22-35% | Novelty helps, but fades fast |
| Seasonal campaign (BFCM, holiday) | 18-28% | Inbox competition is fierce |
Klaviyo's 2026 data shows campaigns averaging 24.8% open rate versus 44.8% for automated flows. Nearly double.
Jay Schwedelson, who has tested over 20 million subject lines through SubjectLine.com, sees blast performance declining year-over-year as inbox providers get better at filtering low-engagement sends to the Promotions tab. His take: treat every blast like it needs to earn its spot. Front-load the value in the subject line. If the subscriber cannot tell why this email matters to them within three seconds, it is getting skipped.
If your blast open rate is below 15% (MPP-adjusted), your list needs cleaning or your subject lines need work. If it is above 25%, you are outperforming most senders. The real leverage is converting your best-performing blasts into automated flows triggered by behavior — that alone can double your open rate on the same content.
Industry standard email open rate
The "industry standard" depends entirely on who is measuring. After pulling data from six platforms covering millions of senders, though, a rough pattern holds.
Most industries land between 28% and 45% on raw open rates (including Apple MPP inflation). Strip out machine opens and the real range is closer to 18-30%.
| Industry | Open rate range | Why |
|---|---|---|
| Religion / Spirituality | 55-56% | Small lists, passionate audiences |
| Nonprofits | 40-54% | Donors are invested in the cause |
| Government / Politics | 38-49% | Spikes around elections, otherwise steady |
| Education | 35-48% | Students and parents open institutional email |
| Health / Fitness | 35-48% | Personal relevance |
| B2B / Professional services | 37-43% | Work email, higher intent |
| SaaS / Software | 36-39% | Product-focused, engaged users |
| Ecommerce / Retail | 30-45% | Widest range — depends on brand loyalty |
| Financial services | 34-38% | Compliance-heavy but trusted |
| Marketing / Advertising | 29-37% | Marketers are the hardest audience to market to |
| Telecommunications | 28% | Lowest across most platforms |
Chad White at Zeta Global, who has been researching email benchmarks for 19 years across Oracle, Salesforce, and Litmus, puts it simply: cross-industry averages are almost meaningless for individual senders. A 30% open rate that is climbing month-over-month is healthier than a 45% rate that is declining. The trend matters more than the number.
The sources behind these ranges: MailerLite (3.6 million campaigns), Klaviyo (183,000+ brands), GetResponse, Mailchimp, ActiveCampaign, Campaign Monitor, and Moosend. Where platforms disagree, the ranges reflect the spread. No single source has the full picture because each platform attracts different types of senders.
For a detailed breakdown of every industry with open rates, CTR, RPR, and deliverability data, see our 2026 email marketing benchmarks by industry guide.
What is a good click-to-open rate (CTOR)?
CTOR measures something different from open rate. Open rate tells you how many people opened the email. CTOR tells you how many of those openers clicked something inside it. It separates content quality from deliverability and subject line performance.
The formula:
CTOR = (unique clicks / unique opens) x 100
1,000 people open your email and 120 click a link. Your CTOR is 12%.
For marketing emails, 10-15% is solid. Transactional and highly targeted emails can clear 30%.
| Email type | CTOR range | Notes |
|---|---|---|
| Automated flows (cart, browse, welcome) | 15-30% | Behavioral relevance |
| Newsletters / content emails | 10-18% | Content quality and CTA clarity |
| Promotional campaigns | 8-15% | Discount-driven clicks |
| Transactional emails | 20-35% | Subscribers expect the content |
CTOR also happens to be immune to Apple MPP inflation. Open rates are polluted by machine opens, but clicks require a human to physically tap a link. No bot does that. In 2026, that makes CTOR one of the few engagement metrics you can still trust at face value.
Dela Quist at Alchemy Worx, who has analyzed over 25 billion emails, argues CTOR is more actionable than open rate because it tells you whether the email content delivered on the promise your subject line made. High opens but low CTOR? Your subject lines are working but your email body is not. Low opens but high CTOR? Fewer people see it, but the ones who do find it worth clicking. Those are two completely different problems requiring two completely different fixes.
Campaign Monitor puts the industry-wide CTOR average at 10-15%. Omnisend's ecommerce data shows automated flows hitting 15-20% while campaigns sit at 8-12%.
Below 8% CTOR? The problem is inside the email — weak calls to action, unclear value, too many competing links, or content that does not match the subject line. Above 15%? Your content is doing its job. Focus on getting more people to open.
What is a good open rate for email newsletters?
Newsletters sit in a strange spot. They are the most common type of marketing email, but they consistently underperform automated flows because nothing triggered them. The subscriber did not just abandon a cart or sign up for something. Your newsletter arrived because it is Wednesday and you publish on Wednesdays.
| Newsletter type | Open rate range | Notes |
|---|---|---|
| Niche B2B newsletter (under 5K subs) | 35-50% | Small, targeted, high-intent |
| Creator / personal newsletter | 30-45% | Personality-driven, strong loyalty |
| Company marketing newsletter | 22-35% | Brand trust matters |
| Large media newsletter (100K+ subs) | 20-30% | Scale dilutes engagement |
| Weekly cadence | 40-48% | MailerLite: weekly outperforms daily |
| Daily cadence | 30-38% | Fatigue effect, but loyal readers stick |
Kath Pay, author of Holistic Email Marketing and a 26-year email strategist who has consulted for eBay and Marks & Spencer, makes a distinction most marketers miss: compare your newsletter open rate against other newsletters, not against your automated flows. Comparing your newsletter's 28% to your welcome email's 75% is not a fair comparison. Different purpose, different moment in the relationship.
MailerLite's data from 3.6 million campaigns shows frequency matters: weekly newsletters average 48.31% open rates versus 41.34% for three-times-per-week. Less frequently means each send carries more weight.
But the biggest factor in newsletter open rates is not timing or frequency. It is how the subscriber joined your list. Organic subscribers (from blog content, SEO, word of mouth) open newsletters at 30-45% in their first 90 days. Subscribers acquired through paid channels (Facebook lead ads, co-registration) open at 15-25%. If your newsletter open rate is low, the first question is acquisition quality, not content or subject lines.
7 reasons your email open rate is low
If your open rates are dropping or consistently below your industry average, the cause is almost always one of these seven issues.
1. You are landing in spam, not the inbox
This is the most common and most overlooked problem. Your delivery rate (emails accepted by the server) might be 97%, but that does not mean 97% reached the inbox.
The global average inbox placement rate is 83.5% (Validity, 2025). That means roughly 1 in 6 emails that "deliver" successfully never reach the inbox. They land in spam, promotions, or get silently filtered.
Microsoft Outlook is the toughest gatekeeper, with B2B inbox placement rates as low as 50.7% for Office 365 (The Digital Bloom, 2025). Gmail sits around 53.7% for B2B senders.
If your authentication is not set up correctly (SPF, DKIM, DMARC), or your spam complaint rate is above 0.1%, you are probably losing a significant chunk of your list to the spam folder. Our email deliverability benchmarks guide covers this in detail.
2. Your list is stale
Email lists degrade by 22-28% per year as people change jobs, switch email addresses, or simply lose interest. If you have not cleaned your list in six months, a meaningful portion of your "subscribers" are ghosts dragging your metrics down and damaging your sender reputation.
3. Your subject lines are not earning the open
Generic, brand-focused subject lines ("March Newsletter" or "New Products Inside") do not give subscribers a reason to open. More on how to fix this in the tactics section.
4. You are sending at the wrong time
If your email arrives at 3 AM and gets buried under 40 other messages by the time someone checks their inbox, the subject line does not matter. Timing is not the biggest lever, but it is an easy one to fix.
5. Your sender name is unrecognizable
Research from Litmus shows 42% of people look at the sender name first when deciding whether to open. If your sender name is a generic "info@" or an unfamiliar brand name, subscribers will skip right past it.
6. You are sending too often (or not often enough)
HubSpot data shows 51% of people who unsubscribe cite "too many emails" as the reason. But sending too rarely is also a problem. If subscribers forget who you are, the next email you send gets flagged as spam. Both extremes destroy open rates.
7. Your list quality is poor
How subscribers joined your list predicts how they will engage with it. Organic subscribers (from blog content, SEO, referrals) open at 30-45% in the first 90 days. Paid-acquisition subscribers (Facebook lead ads, co-registration) open at 15-25%.
Matt McGarry, who has helped add over 10 million newsletter subscribers for clients including James Clear and Sam Parr, emphasizes that cost per subscriber is the wrong metric. What matters is cost per engaged subscriber at 30 days. A free subscriber who never opens is infinitely more expensive than a $3 subscriber who reads every email.
How to improve your email open rate: 12 tactics that work
These are ordered roughly by impact and effort. The first few are infrastructure fixes that protect your ability to reach the inbox at all. The later ones are optimization tactics that move the needle once your foundation is solid.
1. Fix your email authentication (SPF, DKIM, DMARC)
In February 2024, Google and Yahoo began requiring SPF, DKIM, and DMARC authentication for all bulk email senders (5,000+ emails per day). In May 2025, Microsoft joined them with identical requirements for Outlook.
This is no longer optional. As of November 2025, Gmail sends permanent rejection codes (5xx errors) to non-compliant senders. Not spam folder. Rejection.
The data from The Digital Bloom's 2025 deliverability report: senders with full authentication (SPF + DKIM + DMARC) see 83.75% inbox placement. Senders without see 44.99%. That is a 2.7x difference.
What you need:
- SPF record listing all authorized sending services
- DKIM with 2048-bit keys (most ESPs handle this)
- DMARC set to at least p=quarantine (p=reject is better)
- Reverse DNS / PTR records configured
If you are not sure whether your authentication is set up correctly, use Google Postmaster Tools. It is free and will show your domain's authentication status and reputation.
2. Set up BIMI (your logo in the inbox)
BIMI (Brand Indicators for Message Identification) displays your brand logo next to your emails in the inbox. It is supported by Gmail, Yahoo, Apple Mail, and Fastmail.
Only 4.57% of domains have BIMI set up (Validity, 2025). That is a genuine early-mover advantage. Yahoo's pilot study showed a 10% increase in engagement. Red Sift's research found up to 39% open rate lift, though that is a high-end result.
The requirements: DMARC at enforcement level (p=quarantine or p=reject), a Verified Mark Certificate from a certificate authority, and a BIMI DNS record pointing to your SVG logo.
Matthew Vernhout, who chairs the AuthIndicators Working Group that oversees BIMI development, has been pushing for broader adoption. The barrier is the Verified Mark Certificate cost, but for any brand sending serious volume, the inbox placement and trust benefit justifies it.
3. Clean your list and enforce a sunset policy
Removing subscribers who have not engaged in six or more months can increase your overall open rates by 3-5 percentage points within 30 days (Validity/Everest data). Not because those subscribers suddenly start opening, but because removing them improves your sender reputation, which improves inbox placement for everyone who is still engaged.
Troy Ericson, known as "The Email Paramedic," has helped over 900 businesses recover from deliverability crises. His approach: diagnose why emails land in spam, rehabilitate sender reputation through aggressive list cleaning, and rebuild from there. One of his case studies shows a client going from $13K to $51K in monthly email revenue simply by fixing spam folder placement.
A practical sunset policy:
- 90 days of no opens or clicks: trigger a 3-email win-back series
- Include an incentive in the first win-back email (45% higher re-engagement, per Validity data)
- 180 days of no engagement after win-back: suppress
- Do not delete. Suppress. You can always re-activate if needed.
Think of it this way: suppressing disengaged subscribers is not losing subscribers. It is protecting access to your engaged subscribers' inboxes.
4. Write subject lines that earn the open
Jay Schwedelson, founder of SubjectLine.com, has tested over 20 million subject lines. His team executes 40,000+ marketing campaigns per year. If anyone has data on what makes people open emails, it is him.
What the data consistently shows:
Front-load the hook. iPhones truncate subject lines at roughly 35-38 characters in portrait mode. With 60%+ of emails opened on mobile, whatever is in those first 35 characters is your entire pitch.
Specific numbers outperform vague claims. "23.7% more revenue" beats "significantly more revenue" because specificity implies you actually measured something.
Questions work when the reader wants the answer. "Are you making this abandoned cart mistake?" works. "Want to improve your marketing?" does not, because it is too broad to trigger curiosity.
Curiosity gaps work when there is a payoff. "We analyzed 1,000 abandoned cart emails. Here's what we found." works because it promises specific, earned insight. Pure clickbait without payoff trains subscribers to stop opening.
Behavioral personalization beats name personalization. Inserting a subscriber's first name into the subject line used to lift open rates by 20%+. That effect has faded as everyone started doing it. What still works: referencing specific behavior. "Still thinking about the [Product Name]?" outperforms "Special offer for you, Bob" because it is actually relevant.
Nikki Elbaz, who has written email for Shopify, Sprout Social, and Prezi, takes an empathy-first approach. Her framework: identify what the reader is feeling at the moment they see the email, and meet them there. Instead of "Abandoned cart reminder," write "Still thinking it over?" The shift is subtle, but it reframes the email from your agenda to their mental state.
Ben Settle has taken a completely different path. He sends one email per day, every day, with no social media, no content marketing, and no paid ads. His entire multi-seven-figure business runs on email engagement. His philosophy: treat email as entertainment, not marketing. If subscribers look forward to your emails the way they look forward to a favorite show, open rates take care of themselves. That approach is not for every brand, but the principle underneath it is universal. People open emails from senders they enjoy hearing from.
5. Optimize your preview text
Preview text (the snippet of text visible after the subject line in the inbox) is the most underused piece of real estate in email marketing.
If you do not set it, the email client pulls the first visible text from your email body. That is usually "View in browser" or an unsubscribe link. Wasted space.
The right approach: treat your subject line and preview text as a single unit. The subject line is the hook. The preview text is the context or payoff.
Example:
- Subject: "Your cart is waiting"
- Preview: "Plus, we saved your free shipping for 24 more hours"
Keep preview text to 40-70 characters. After your preview text in the HTML, add zero-width space characters (͏) to prevent the email client from pulling in additional body text.
6. Lock down your sender name
Litmus research shows 42% of people look at the sender name before the subject line. For many subscribers, the sender name is the open rate.
The "Person from Brand" format (like "Sarah from Geysera") tends to outperform both pure brand names and pure personal names for SaaS and ecommerce. It combines personal warmth with brand recognition.
Ann Handley's "Total Annarchy" newsletter is a good case study. It arrives from "Ann Handley" to 51,000+ subscribers every other Sunday, and its open rates far exceed industry averages. The sender name is the brand. Subscribers know exactly who is writing to them and what to expect. That consistency is the point.
Keep sender names under 20 characters (mobile truncation) and do not change them. Inconsistent sender names trigger both subscriber distrust and spam filter suspicion.
7. Segment by engagement first
Segmented campaigns see 14-30% higher open rates than unsegmented blasts (Mailchimp, HubSpot, Klaviyo data). That is one of the most consistently replicated findings in email marketing.
Val Geisler, who built much of Klaviyo's email education content and now leads lifecycle marketing at Digioh, advocates for "engagement-first segmentation." The idea: engagement recency should be your primary segmentation axis, layered on top of everything else.
A practical engagement segmentation:
- Engaged (opened or clicked in last 30 days): Full sending cadence. These subscribers are keeping your sender reputation alive.
- Semi-engaged (60-90 days since last engagement): Reduce frequency. Send your best content only.
- Disengaged (90+ days): Win-back flow only. Stop sending campaigns.
Sending only to 30-day engaged subscribers can push open rates to 40-55%. More importantly, it improves deliverability for your entire list because Gmail, Yahoo, and Outlook all use engagement signals to decide whether your emails reach the inbox.
Kath Pay, author of Holistic Email Marketing and a strategist with 26+ years of experience consulting for brands like eBay and Marks & Spencer, ranks segmentation inputs this way: (1) engagement behavior, (2) purchase or transaction behavior, (3) declared preferences, (4) demographic data. Behavioral data should override demographic data. Always.
8. Use send time optimization
AI-powered send time optimization delivers each email at the individual subscriber's best time based on their historical engagement patterns. It is available on Klaviyo, Brevo, Salesforce Marketing Cloud, and others.
The lift is real: 8-15% higher open rates versus fixed-time sends (platform-reported data from Klaviyo and Brevo).
If your ESP does not offer per-subscriber STO, the baseline approach still helps: send during business hours in the recipient's local timezone. That alone avoids the worst-case scenario of landing at 3 AM.
Jordie van Rijn, who runs one of the longest-standing email benchmark research sites at EmailMonday.com, has found that per-subscriber STO outperforms fixed "best time" recommendations by 7-13% because individual patterns vary too much for averages to capture.
9. Invest in automations over campaigns
This is probably the single highest-leverage change most email marketers can make.
The performance gap between automated emails and manual campaigns is not a rounding error. It is a different order of magnitude:
- Automated flows: 44.8% open rate. Campaigns: 24.8% (Klaviyo)
- Flows generate 41% of email revenue from 5.3% of sends (Klaviyo, 2026)
- Automated emails produce $2.87 revenue per email vs $0.18 for campaigns (Omnisend)
Chris Orzechowski, whose agency Orzy Media has generated over $100 million in email-attributed revenue for DTC brands, focuses heavily on building out flow infrastructure before optimizing campaigns. The logic: automations fire when the subscriber is most engaged (they just signed up, abandoned a cart, made a purchase), so relevance and timing are built in.
Priority automations to build or optimize:
- Welcome series (68-83% open rates)
- Abandoned cart (39-50%)
- Post-purchase and review request (60-70%)
- Browse abandonment (35-45%)
- Back-in-stock alerts (58-65%)
10. Optimize your welcome series
Welcome emails have the highest open rates of any email type: 68-83%. This is your single best opportunity to set expectations, build trust, and establish the engagement patterns that will carry through the rest of the subscriber's lifecycle.
The data point that matters most: welcome emails sent within one minute of signup see 10x higher engagement than those delayed by even one hour (industry benchmark data). If your welcome email has a delay, remove it.
Eman Ismail, who has built a $250K/year email strategy practice working with six- and seven-figure online businesses, focuses heavily on the welcome sequence as the foundation of long-term engagement. Her approach: the welcome email is not a formality. It is the moment when subscriber expectations are set. Deliver the promise (the discount, the lead magnet, the value) in email one. Brand story in email two. Social proof in email three.
A counterintuitive finding: plain-text welcome emails sometimes outperform designed HTML emails because they feel personal and bypass the Gmail Promotions tab.
11. Guard your sender reputation
Sender reputation is the single most important factor in inbox placement. Gmail, Yahoo, and Outlook all use reputation scoring to decide whether your emails reach the inbox, land in spam, or get rejected outright.
The shift in 2026: domain reputation now matters more than IP reputation. Most senders use shared IPs through their ESP, so mailbox providers have moved to evaluating your sending domain as the primary identity.
Key thresholds:
- Spam complaint rate below 0.1% (Google's 0.3% is the enforcement line, not the safe zone)
- High reputation (score above 70): 92% inbox placement
- Below 70: inbox placement drops under 50%
Monitor through Google Postmaster Tools and Yahoo Sender Hub. Both are free.
Al Iverson, who spent 15 years as Director of Deliverability at ExactTarget (now Salesforce Marketing Cloud) and now leads industry research at Valimail, runs the "Ask Al" video series covering practical deliverability guidance. His consistent advice: sender reputation is a lagging indicator. By the time you notice it dropping, the damage has been building for weeks. Monitor proactively.
Domain age also matters. New domains (under 3 months) see roughly 55% inbox placement. Domains aged 2+ years see 85%. If you are launching a new sending domain, warm it up gradually: start with 5-10 emails per day to your most engaged subscribers and increase volume by no more than 20% per day.
12. Measure what actually matters (beyond open rates)
Open rates are useful as a trend indicator. They are increasingly useless as an absolute metric. Chad White recommends tracking open rates against a non-Apple "proxy audience" to approximate real engagement, but even that is an estimate.
A more complete measurement framework for 2026:
Click-through rate (CTR) is your most reliable engagement metric. Apple MPP does not affect click tracking. If your CTR is healthy, your emails are working regardless of what the open rate says.
Revenue per recipient (RPR) is the business metric. Klaviyo data shows that top 10% email flows achieve RPR as high as $7.79 with click rates over 10%.
Spam complaint rate is the health metric. Stay under 0.1%. Check Google Postmaster Tools weekly.
Open reach (Dela Quist's concept) tracks the number of unique contacts who opened any email over a 30-day or 90-day period rather than measuring per-campaign opens. A subscriber who opens 1 out of 8 emails is still engaged. Per-campaign open rate would miss that.
Carin Slater at Litmus works with their Email Analytics product, which helps marketers separate MPP-inflated opens from genuine engagement. Litmus data shows brands using email analytics see 43% higher ROI than those that don't. The takeaway: invest in understanding your data, not just collecting it.
Want help implementing these tactics? Geysera helps ecommerce brands build automated email flows that drive 40%+ open rates and recover abandoned revenue. See how it works.
Are email open rates still worth tracking in 2026?
Yes, with caveats.
Open rates still work as a trend indicator. If your open rate drops 5 points over two months, something changed: your deliverability, your content, your list quality. That signal is still valid even if the absolute number is inflated.
What open rates no longer do well: compare across platforms, compare against benchmarks from different ESPs, or serve as a proxy for actual engagement. For that, you need clicks, conversions, and revenue data.
The direction things are heading:
Authentication is becoming the price of admission. Google, Yahoo, and Microsoft now require SPF, DKIM, and DMARC for bulk senders. Laura Atkins, co-founder of Word to the Wise and a deliverability specialist with over 20 years of experience, puts it plainly: email authentication is "the price of entry for email delivery in 2026." Senders who have not caught up will face rejection, not just spam folder placement.
BIMI adoption is growing. With only 4.57% of domains using it today but 28% year-over-year growth, early adopters have a real visibility advantage in the inbox.
AI-powered predictive engagement is emerging. Platforms like Klaviyo are developing Predicted Engagement Scores that combine open velocity, scroll depth, and session time to forecast purchase likelihood. These will eventually replace open rates as the primary engagement metric for sophisticated senders.
The floor is rising. Poorly authenticated senders, dirty lists, and spray-and-pray campaigns will see their open rates crater as mailbox providers get more aggressive about filtering. Well-run email programs will see theirs hold steady or improve.
Guy Hanson, VP of Customer Engagement at Validity and one of the most cited voices in email deliverability research, frames it this way: the focus is shifting from simply reaching the inbox to proving you belong there.
The bottom line
A good email open rate in 2026 is 20-25% if your ESP filters machine opens, or 35-45% if it does not. Welcome emails should be above 60%. Automated flows should be above 40%. Campaign newsletters between 20-35% depending on your industry and list size.
But the absolute number matters less than the trend. Track your own rates month over month. Compare against your own benchmarks. Use clicks and revenue to validate.
If your open rates are declining, work through the 12 tactics above in order. Fix authentication first. Clean your list second. Then optimize subject lines, preview text, segmentation, and automations. The compounding effect of getting the fundamentals right is bigger than any single clever tactic.
The best email marketers in 2026 are not obsessing over open rates. They are obsessing over relevance, deliverability, and the subscriber experience. Open rates are a side effect of getting those things right.
Frequently asked questions
What is a good email open rate in 2026?
A good email open rate in 2026 is 20-25% on an MPP-adjusted basis (filtering out Apple Mail machine opens), or 35-45% if your ESP includes all opens. "Good" varies by industry, list size, and email type. Welcome emails average 68-83%, while promotional campaigns average 15-32%.
What is the average email open rate?
The average email open rate in 2026 ranges from 19.21% (Mailchimp, MPP-adjusted) to 43.46% (MailerLite, including machine opens). The true human-engaged average is likely between 20-25%. The gap is caused by Apple Mail Privacy Protection pre-fetching tracking pixels.
What is a good open rate for email marketing by industry?
It depends on your industry. Nonprofits and religious organizations see the highest open rates (40-56%). SaaS and software companies average 36-39%. Ecommerce averages 30-45% depending on the platform. Marketing and advertising companies average 29-37%. Use the industry table in this guide for your specific vertical.
How does Apple Mail Privacy Protection affect open rates?
Apple MPP pre-loads email content (including tracking pixels) on Apple's servers before subscribers see the message. This registers false "opens" even when subscribers never looked at the email. Apple Mail accounts for 49-54% of all email opens, and roughly 95% of Apple Mail users have MPP enabled. This inflates reported open rates by 15-25 percentage points for most senders.
How can I improve my email open rate?
The highest-impact improvements are: (1) Fix email authentication (SPF, DKIM, DMARC) for 2.7x better inbox placement. (2) Clean your list and suppress subscribers who have not engaged in 6+ months. (3) Segment by engagement level. (4) Optimize subject lines and preview text. (5) Invest in automated flows over manual campaigns. See the 12 tactics section for the full breakdown.
What is the difference between delivery rate and inbox placement rate?
Delivery rate measures how many emails were accepted by the receiving server (not bounced). It is typically 96-98%. Inbox placement rate measures how many of those delivered emails actually reached the inbox (not spam or promotions tab). The global average inbox placement rate is 83.5%. A 97% delivery rate with 83% inbox placement means about 1 in 6 of your "delivered" emails never reach the inbox.
Are email open rates still accurate in 2026?
Not entirely. Apple Mail Privacy Protection and similar pre-fetching by other email clients inflate open rates by registering false opens. Open rates are still useful as a trend indicator (tracking changes over time) but should not be used as an absolute measure of engagement. Click-through rate and revenue per recipient are more reliable metrics in 2026.
What is a good open rate for email blasts?
For a typical email blast (one send to your full list, no segmentation), expect 15-25% on an MPP-adjusted basis or 25-35% raw. Promotional blasts tend to land at the low end (15-25%), while announcements and educational sends perform better (22-35%). Blasts consistently underperform automated flows, which average 44.8% in Klaviyo's data. If your blast open rate is below 15%, focus on list hygiene and subject line quality first.
What is the industry standard email open rate?
It ranges from 28% (telecommunications) to 56% (religious organizations) depending on the industry. Most fall between 30-45% on raw rates or 18-30% MPP-adjusted. Nonprofits, education, and health tend to be above average. Ecommerce sits at 30-45% with wide variation by brand. Marketing and advertising companies see some of the lowest rates (29-37%), because marketers are a tough audience. The trend month-over-month matters more than any single benchmark.
What is a good click-to-open rate (CTOR)?
A good CTOR is 10-15% for marketing emails. Automated flows (cart abandonment, welcome, browse) typically hit 15-30%, while promotional campaigns sit at 8-15%. CTOR is calculated as unique clicks divided by unique opens, and it measures content quality separately from deliverability. Unlike open rate, CTOR is not inflated by Apple MPP because clicks require a human to physically tap a link.
What is a good open rate for email newsletters?
Newsletter open rates range from 20-50% depending on list size, niche, and frequency. Small B2B newsletters (under 5K subscribers) typically see 35-50%. Company marketing newsletters average 22-35%. Large media newsletters (100K+) see 20-30%. Weekly sends outperform daily sends (48% vs 41% per MailerLite). The biggest factor is how subscribers were acquired — organic subscribers open at 30-45% while paid-acquisition subscribers open at 15-25%.
Related reading
- Email marketing benchmarks 2026: the complete guide — Our pillar guide covering all email metrics, not just open rates
- Are email open rates dead in 2026? — A deeper look at whether open rates still matter after Apple MPP
- Email click-through rate benchmarks 2026 — The metric that should replace open rates as your primary KPI
- Email deliverability benchmarks 2026 — Inbox placement rates, sender reputation, and authentication
- Email automation vs campaigns: performance data for 2026 — Why automated flows outperform campaigns by 3-13x
- Revenue per email: the metric that matters most — How top ecommerce brands measure email success
- Email marketing benchmarks by industry 2026 — Detailed breakdowns for 20+ verticals
Related reading:

Co-Founder and CEO
Bob Thordarson is CEO and Co-Founder of Geysera, a serial entrepreneur with 25+ years and five co-founded ventures, including Cequint (acquired by TNS in 2010 for $112.5M) and Consumerware (acquired by ParkerVision). A graduate of the University of Washington and MIT Entrepreneurial Masters Program, based in Seattle, he serves on the boards of DRY Soda Co. and the Entrepreneurs' Organization Seattle chapter. He is an expert in retention marketing email systems and methodology for ecommerce and B2B brands — measured by incremental revenue, not vanity metrics.