Website Visitor ID Match Rates Decoded: Why 40%+ Person-Level Claims Are Usually Fiction
Every visitor identification vendor publishes a match rate, and almost none of them mean the same thing by it. This guide compares the published claims of 15 B2B vendors side by side, shows how the number is actually calculated, explains why one product is currently advertised at four different rates at once, and gives you a self-audit you can run on your own traffic in an afternoon.
Key benchmarks at a glance
| Metric | Figures |
|---|---|
| Highest published person-level match rate claim | 55% — Vendor claims run from about 15 percent (Warmly) to 55 percent (Happierleads). RB2B publishes 40-45 percent, Common Room up to 50 percent, Bullseye up to 40 percent. |
| Highest published company-level match rate claim | 80% — Happierleads publishes 80 percent or more, Demandbase 77 percent measured on its own site, Factors.ai up to 75 percent, Bullseye up to 70 percent, RB2B 30-35 percent. |
| Independently tested person-level match rate, upper bound | 20% — MarketBetter tested 12 platforms and found realistic person-level identification of 5-20 percent, with RB2B at 10-20 percent. |
| Vendors publishing a confidence interval or margin of error | 0 — Of 15 vendors reviewed, 14 publish a match rate percentage, 9 state a geography qualifier, 3 define their denominator, 1 (Factors.ai) states the sample size the figure rests on, and none publish an interval or margin of error. |
A match rate is the share of your website visitors that an identification tool can resolve to a name — either the individual person or the company they work for. It is published as a single percentage, compared across vendors like a spec-sheet number, and calculated on a denominator that almost no vendor discloses.
There's a number at the center of every website visitor identification pitch, and in my experience it's usually the least verifiable number in B2B software.
The match rate is supposed to answer a simple question: of the people who come to my site, how many will this tool actually name? Every vendor publishes one. Across the tools we surveyed for this post they run from 15% to 80%, and once you include consumer identity tools, up to 99.5%. They are calculated on different denominators, at different levels of resolution, over different geographies, and almost none of them can be checked before you sign.
Match rates aren't the only thing that matters, but the way a vendor talks about theirs tells you most of what you need to know about the rest of the product.
KEY STATS
- Published B2B person-level match rates span 15% to 55% — a range too wide for the vendors to be measuring the same thing (compiled July 2026)
- The same product, RB2B, is currently published at four different person-level rates: 8-15%, 10-20%, ~30%, and 40-45%, depending on who is publishing
- RB2B's support documentation lists contact-level identification at 40-45% and company-level at 30-35% for US traffic, then describes overall identification as 70-80% — the two figures added together (RB2B, 2026)
- Independent testing across 12 platforms puts realistic person-level identification at 5-20% and company-level at 30-65% (MarketBetter, 2026)
- Consumer ecommerce tools publish 40-85%, and LiveRamp reports 99.5% on full PII — benchmarking a B2B tool against those numbers guarantees disappointment
- Only 3 of the 15 vendors surveyed state the denominator their match rate is calculated on, 1 states a sample size, and none publishes a confidence interval (compiled July 2026)
- B2B contact data goes stale at somewhere between 22.5% and 30% a year, so a match rate measured at signup overstates what you will have twelve months later (MarketingSherpa via HubSpot; ZoomInfo, 2026)
- Just 1 of the 15 vendors surveyed — Lead Forensics — declines to publish a match rate at all, offering a trial on your own traffic instead
- Data compiled from vendor documentation, published comparison pages, and third-party testing, July 2026
What's in this guide:
- What is a match rate, exactly?
- Why the same tool gets four different match rates
- The four tricks that inflate a match rate
- What the published claims actually say
- The five-step match rate self-audit
- What a good answer from a vendor sounds like
- Frequently Asked Questions
What is a match rate, exactly?
Every match rate you'll ever be quoted is a fraction, and all of the trouble lives in what a vendor decides to put above and below the line before they show it to you.
The numerator is how many visitors the tool managed to put a name to, and the denominator is how many visitors it was given a fair chance to name in the first place. Change either one and the same underlying performance produces a wildly different percentage. A tool that names 150 people out of 1,000 unique US visitors is at 15%. Take that same 150 and divide it by only the visitors who hit a pricing page, and you can call it 40%. Divide it by unique visitors instead of sessions and it moves again.
None of that requires anybody to lie to you. It only requires that they decline to mention which fraction they used, and almost nobody volunteers it.
There's a second, larger problem underneath the arithmetic, which is that "put a name to" means two completely different things in this category:
- Company-level identification tells you that someone from Acme Corp visited. You get an organization, not a human. It's mostly reverse-IP lookup, and it's comparatively easy.
- Person-level identification tells you that Dana Whitfield, VP of Operations at Acme, visited, and gives you a work email. That's much harder, it works mainly on US traffic, and it runs on the identity graph mechanics we covered in Post 3.
Those two numbers aren't comparable in any useful sense, and they routinely get presented in a way that makes mistaking one for the other extremely easy.
Why the same tool gets four different match rates
One product carries four published match rates because each publisher measured different traffic, over a different window, against a different definition of a match, and none of them published the method. You can verify all four of these numbers yourself in about ten minutes. It took me an afternoon to assemble the first time, and I used nothing a buyer doesn't already have — a browser, and a spreadsheet to keep the sources straight.
Take RB2B, which is one of the best-known person-level tools in the category. As of this writing, four different published sources give four different person-level match rates for that one product:
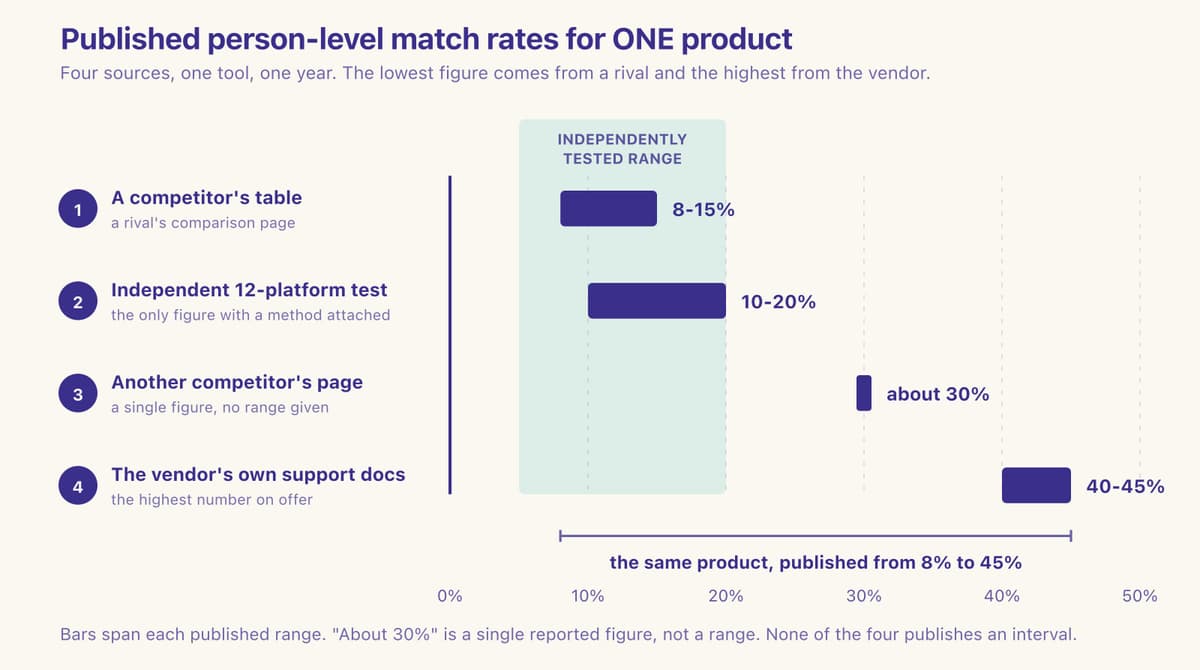
- 40-45% — RB2B's own support documentation, describing what Pro users typically see on unique US-based traffic.
- About 30% — Bullseye's comparison page, which puts its own rate at "up to 40%" against RB2B at "~30%."
- 10-20% — MarketBetter's independent review, which reports testing 12 platforms.
- 8-15% — Warmly's published comparison table.
Four numbers. A factor of five between them, for the same software in the same calendar year. They simply can't all be describing the same thing, and once you accept that, the useful question stops being "which number is right" and becomes "what was each one measuring."
They are measuring different traffic, over different windows, against different definitions of what counts as a match. When a metric is this sensitive to methodology and nobody publishes their methodology, the metric carries almost no information. It tells you what the publisher wanted you to believe, and very little about what will happen on your website.
Notice who holds the incentive in each direction. The vendor's own number is the highest. Competitors' numbers for that vendor come in lower, and conveniently lower than their own. The independent tester lands near the bottom. That pattern repeats across the category.
RB2B isn't remotely unusual here: it's simply the best-documented case, because more people have bothered to publish a number for it than for anyone else.
Vector's contact-level rate appears as 35% on a partner's announcement page, as 15-30% in its own materials, and as 55-70% in a claim about ad audiences rather than site traffic. Factors.ai publishes "up to 75%" of companies identified in one place and "up to 64%" from its own 20,000-IP test in another. Once you start pulling these threads, the single-number match rate stops looking like a specification and starts looking like a marketing asset.
The four tricks that inflate a match rate
Not one of these tricks requires anybody to state a falsehood, and every single one of them produces a bigger number than the underlying performance justifies.
1. Adding company-level and person-level together
This is the trick I see most often. RB2B's support documentation lists contact-level identification at 40-45% and company-level identification at 30-35%, and then describes overall identification rates for US traffic as falling between 70-80%. I read that page three times before I accepted that the arithmetic was really that simple.
Look at the arithmetic: 40-45 plus 30-35 gives you 70-80. The headline figure is the two levels added together. The same documentation notes that person-level and company-level are independent processes and a match at one doesn't imply a match at the other, which is the correct technical disclosure. But adding two independent rates isn't how you combine them. If both processes can fire on the same visitor, some of those visitors are being counted twice, and the true share of traffic that produced any record is lower than the sum.
More importantly, 70-80% isn't a person-level number and must not be read as one. Roughly half of it's "a company visited," which you can't email, can't route to a rep as a lead, and could largely have gotten from a reverse-IP tool at a fraction of the price.
The independent view is blunter. As MarketBetter put it after testing twelve platforms: "80% match rate usually means 80% of companies identified, not people. Person-level identification is much harder, and most tools quietly inflate their numbers by mixing the two."
2. Quoting a US-only rate as though it were your whole site
Person-level identification remains largely a US phenomenon, because the United States is where the consumer-scale identity graphs and a regulatory environment permissive enough to query them against strangers happen to overlap. Most vendors are explicit that non-US traffic gets company-level resolution only.
That disclosure is fine. The problem arrives with the multiplication, which the vendor leaves to you. If 40% of your traffic is outside the US, then a real 40% US person-level rate is a 24% whole-site rate. Both numbers are true. Only one of them describes your bill.
I've sat through a fair number of these calls and I've never once watched a vendor do that multiplication unprompted.
The US rate is the number in their deck, the deck was built for a US-heavy pipeline, and nobody in the room has your traffic split in front of them. So bring it yourself. Pull your non-US share before the call and ask them to do the arithmetic live.
3. Filtering the denominator down to "qualified" traffic
Some rates are quoted against visitors who reached a high-intent page, or who spent more than some threshold of time, or who weren't filtered out as bots and ISPs. Those are defensible engineering choices, and they shrink the denominator, which raises the percentage. If a vendor quotes you a rate, ask what fraction of your total sessions it applies to.
When I've asked that on a call, the answer has usually come back as a range rather than a figure, and the range has usually been wide enough that the headline rate stopped carrying much meaning the moment I wrote it down beside the slice of traffic it actually described.
A competitor states the arithmetic bluntly:
"Anchor expectations to 30-65% company-level and 5-20% person-level for US B2B traffic with a corporate buyer mix. That is the honest band, and any vendor pitching higher numbers is either using a non-standard denominator or counting only the slice they already match. […] The honest denominator is total page views minus bots." — Austin Hughes, Co-Founder and CEO, Unify (Unify, archived June 2026)
4. Counting a match without checking it still works
A match rate gets measured at the exact moment of resolution, which means it tells you nothing whatsoever about whether the email will bounce when a rep tries it or whether the person walked out of that company eight months ago. Given that B2B contact data decays somewhere between 22.5% and 30% a year, a headline rate is a snapshot of a decaying asset. What you care about is the share of matches you can act on, which is always lower.
We quote that decay as a range rather than the flat 30% you'll see everywhere. I went looking for a source that supported a bare 30% and couldn't find one.
The low end comes from HubSpot's database decay work at 2.1% a month, the high end from ZoomInfo at 25-30%.
What the published claims actually say
Here are the published claims, compiled in July 2026 from vendor documentation, vendor comparison pages, and third-party testing. Every figure below is what that source publishes, not our assessment of what the tool delivers.
I took each one from the source itself rather than from somebody else's roundup. That is slower, and it caught something a copied table would have missed — when I re-checked the set in late July, two rows had moved since our earlier pass, RB2B's among them.
My own count of this table was wrong twice. I first wrote "20+ vendors," which only holds if you fold in the four consumer tools further down that this post explicitly calls not comparable. Then I wrote 16, which double-counted Clearbit and Breeze — one company under two names — and counted MarketBetter, which tested the tools rather than selling one.
It's 15. You can count the rows yourself.
B2B person-level claims
This is the only number that really matters for outreach, because it's the one that arrives with a human name and a work email attached to it rather than just a company logo.
| Vendor | Published person-level claim | Qualifier the vendor states | Verifiable on your traffic? |
|---|---|---|---|
| Happierleads | 30-55% of B2B sessions | Geography-dependent; person-level outside GDPR zones only | No |
| Common Room (with Vector) | Up to 50% | US-based web traffic only | No |
| RB2B | 40-45% | Pro plan, unique US traffic | No |
| Bullseye | Up to 40% | US B2B traffic | No |
| Vector | 35% on a partner page; 15-30% in its own materials | US-based web traffic | Labels verified vs inferred |
| Leadpipe | 30-40%+ deterministic | Describes 30-40% as the deterministic ceiling | No |
| Instantly (TrafficID) | ~30% of total visitors | Claims 95%+ confidence on matched fields | No |
| ZoomInfo WebSights | No verifiable published figure — product page 404s (Sept 2026) | Withdrew its published rate | No |
| Warmly | 15-25%, averaging ~15% | Via enrichment partnerships | No |
| Clearbit / Breeze (HubSpot) | No verifiable published figure — product page 404s (Sept 2026) | Withdrew its published rate | No |
| Demandbase | Under 30% per third parties | Publishes 77% at account level on its own site | No |
| Lead Forensics | Declines to publish a number | Company-level only, reverse-IP | Yes — offers a trial on your traffic |
The takeaway: Published person-level claims run from about 15% at Warmly to 55% at Happierleads, a spread too wide for these vendors to be measuring the same quantity. Two of the twelve, ZoomInfo and Clearbit/Breeze, no longer publish a figure we can check at all — their product pages 404 as of September 2026. RB2B publishes 40-45% for its Pro plan on unique US traffic, Common Room up to 50%, Instantly about 30%.
Company-level claims
Company-level matching is a much easier problem, it produces much higher numbers, and it's far more likely to be quoted at you with the word "company" quietly left off.
| Vendor | Published company-level claim |
|---|---|
| Happierleads | 80%+ |
| Demandbase | 77% (measured on its own site) |
| Factors.ai | "Up to 75%" in one place; "up to 64%" from its own 20,000-IP test in another |
| Bullseye | Up to 70% |
| Warmly | ~65% for US traffic (30-65% range) |
| Clearbit / Breeze | No verifiable published figure — product page 404s (Sept 2026) |
| RB2B | 30-35% |
| Albacross | ~30% |
| Snitcher | 25-30% |
The takeaway: Company-level claims cluster far higher than person-level ones, from Snitcher at 25-30% up to Happierleads at 80% or more. Demandbase publishes 77%, measured on its own site. Factors.ai quotes up to 75% in one place and up to 64% from its own 20,000-IP test in another. The distance between naming a company and naming a person explains most of the spread.
What third parties observe
Wherever somebody other than the vendor did the measuring, the numbers fall, and across the sources in this table they fall in the same direction without exception.
| Source | Method | Person-level finding |
|---|---|---|
| MarketBetter | Tested 12 platforms | Realistic person-level 5-20%; RB2B at 10-20% |
| Warmly | Published comparison table | RB2B ~8-15%, 6sense ~5-10%, Leadpipe ~10-15% |
| Leadpipe | Category glossary | 15-35% for the best tools; 80%+ person claims indicate probabilistic guessing |
The takeaway: Independent testing lands well below vendor marketing. MarketBetter tested 12 platforms and put realistic person-level identification at 5-20%, with RB2B at 10-20%. Warmly's published comparison shows RB2B at 8-15% and 6sense at 5-10%. Leadpipe's glossary puts the best tools at 15-35% and treats any person-level claim above 80% as probabilistic guessing rather than resolution.
Three things jump out of that table once you read the columns against each other.
The credible claims all cluster in the mid-teens. Strip out the combined figures and the company-level numbers wearing person-level clothing, and what remains converges around 15-20%, with independent testing pulling toward 5-20%. Vendors quoting 40% and up are describing something the rest of the market doesn't recognize as the same measurement.
Vendors agree with each other about everyone except themselves. Warmly puts RB2B at 8-15% and itself at 15-25%. Bullseye puts RB2B at ~30% and itself at up to 40%. RB2B puts itself at 40-45%. Every published table is lowest where the publisher has the least to gain, which tells you these are competitive artifacts rather than measurements.
One column is almost entirely "no." Nearly every player in this category publishes a headline number that a prospect simply can't check before signing, and independent verifiability is almost always "no." The one vendor that refuses to publish a rate at all, Lead Forensics, does so on the grounds that the only meaningful number always comes from your own traffic. That is an inconvenient position for a marketing team, and it's also the most defensible answer anyone in this category gives.
What none of them publish
Set the percentages aside for a moment and look at the measurement around them. I went back through the same 15 vendors asking a narrower question — not what the number is, but what any of them disclose about how it was produced. That table is bleaker than the claims themselves, and it's the one table in this post we built ourselves rather than transcribed.
| What we looked for | Vendors publishing it, out of 15 |
|---|---|
| A person-level or company-level percentage | 12 |
| A stated geography qualifier | 9 |
| A stated denominator definition | 3 |
| A sample size the figure rests on | 1 |
| A confidence interval or margin of error | 0 |
The takeaway: Twelve of the 15 publish a percentage and exactly one, Factors.ai, publishes the sample size underneath it, describing a test across 20,000 IPs. Not one of the 15 publishes an interval or a margin of error. Lead Forensics is the only vendor declining to publish a rate at all, offering a trial on your own traffic instead of a figure.
The Factors.ai row cuts against the rest of the table, and I think disclosing that sample size cost them something. They publish up to 75% of companies identified in one place and up to 64% from the 20,000-IP test in another, and the tested figure is the lower of the two. That is almost always what happens when somebody attaches a method to a number, and it's a fair guess at why so few of them bother.
Both of the missing rows matter, for different reasons. A percentage with no sample size behind it simply can't be checked. A percentage with no interval around it can't be compared with another one, which is the whole activity I assume you're trying to perform with a table like this. Until a buyer asks for both, that stays entirely the buyer's problem rather than the vendor's.
We publish no percentage, which puts us in the same row as Lead Forensics rather than on any moral high ground — declining to give you a number is easier than defending one.
We are not the only ones saying this
Warmly published a piece called "Website Visitor Identification Match Rates: What Every Vendor Won't Tell You," and its co-founder puts the demo-versus-reality gap in one sentence:
"Demo match rates run 3-5x higher than what you'll see in production." — Alan Zhao, Co-founder and Head of Marketing, Warmly (Warmly)
Three to five times. That is a competitor's estimate of the gap between what a vendor shows you in a controlled demo and what the same tool returns once it's pointed at your actual traffic, and the same piece goes on to tell buyers to demand a proof-of-concept on their own domain and to insist that company and person rates be reported separately. Leadpipe's glossary makes the denominator point plainly: some vendors count sessions rather than unique visitors, which inflates the number.
Both of those pieces are correct, and I'd read them before you read any vendor's pricing page.
One caution on comparison lists
Several widely-shared 2026 "best visitor ID tools" roundups still list Koala, which shut down on September 30, 2025 after Cursor acqui-hired its team that July. I hit it in more than one of them while checking sources for this post. If a comparison table you're reading still recommends a product that has been dark for most of a year, treat its match-rate column with the same skepticism.
Why the ecommerce numbers look so much better
If you've seen dramatically higher figures quoted somewhere, check first whether the tool is doing B2C consumer identification rather than B2B. That is never the same problem. Different graph, different economics, and a ceiling no B2B vendor can reach.
I keep this table in the post because a buyer once quoted LiveRamp's 99.5% back at me as though it set the bar for what I should be able to do on their website, and I didn't have a clean way to explain the gap on the spot.
| Vendor | Claim | Category |
|---|---|---|
| LiveRamp | 99.5% on full PII with complete address data, measured by Comscore | Consumer identity resolution |
| Customers.ai | 65-85% accuracy | B2C ecommerce |
| Opensend | Up to 73% for US shoppers | B2C ecommerce |
| Retention.com | Up to 40%; third parties observe 16-25% | B2C ecommerce |
The takeaway: Consumer identity tools publish much higher rates because they resolve a different problem. LiveRamp reports 99.5% on full PII with complete address data, independently measured by Comscore in Q1 2026. Opensend claims up to 73% for US shoppers and Customers.ai 65-85% accuracy. Benchmarking a B2B tool against these guarantees disappointment, because consumer graphs match household records, not work identities.
Consumer graphs are far denser and built on much more stable identifiers, which is exactly why they can post numbers that no B2B tool will ever be able to touch. We covered the underlying reason in Post 3.
The five-step match rate self-audit
You can run this audit yourself during a trial, in a single afternoon, with nothing more than a spreadsheet.
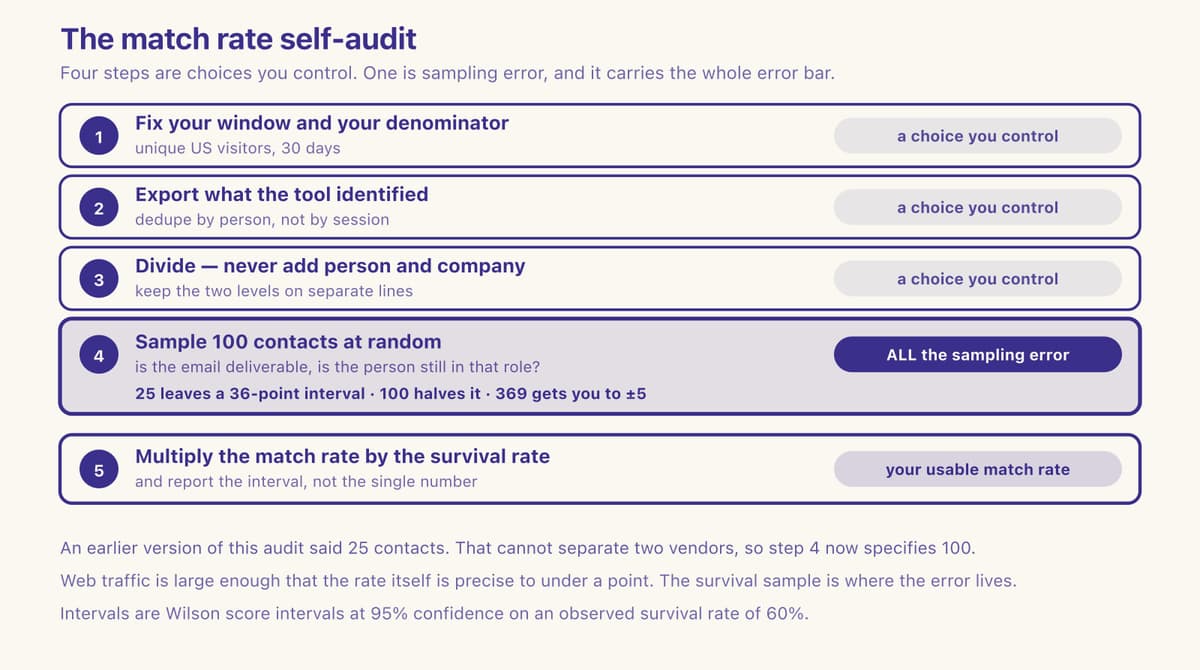
Step 1 — Fix your window and your denominator before you look at anything. Pick 30 days. From your analytics, pull unique visitors, not sessions and not pageviews. Then split out the US share, because that's the only slice person-level resolution really applies to. Write both numbers down before you open the vendor's dashboard, so you aren't tempted to pick the denominator that flatters the result.
Step 2 — Export what the tool identified over exactly that window, and dedupe by person. One person who visited nine times is one match. Tools that report identifications rather than identified people will inflate here, and it's the easiest inflation to remove.
Step 3 — Divide, and keep the two levels apart. Person-level matches divided by unique US visitors gives you your person-level rate. That is the figure to compare against everything published in the table above.
Company-level matches divided by unique visitors is a separate figure. Write them on separate lines. Never add them. We report the two on separate lines in our own product for the same reason, and it makes our headline number look worse than it would blended. If a vendor's dashboard shows you a single blended number, ask it to break them out, and treat reluctance as an answer.
Step 4 — Sample 100 identified contacts at random and check whether they survive contact with reality. For each one: does the work email pass a deliverability check, and does the person still appear to hold that role at that company? Count how many clear both bars. That fraction is your survival rate. This is the step that catches decay, and it's the step nobody runs.
On the sample size, because we got this wrong ourselves. An earlier draft of this step told you to sample 25 contacts, which isn't enough to decide anything. I wrote that number before I ran the interval on it, which is exactly the order of operations this whole post is arguing against.
At 25, a survival rate that comes back 60% carries a 95% confidence interval of 40.7% to 76.6% — a spread of 36 points, on a measurement you're using to separate one vendor from another.
A hundred contacts brings that to roughly plus or minus 9 points, and 369 gets you to plus or minus 5. If the decision is close, use 100 and report the interval rather than the single number.
Step 5 — Multiply. Person-level rate times survival rate equals your usable match rate. That's the only number that maps to pipeline. A 40% rate where half the contacts bounce or have moved on is a 20% tool that costs what a 40% tool costs.
Run this against two vendors inside the same 30-day window, on the same traffic, and you'll end up holding two numbers produced the same way, on your visitors.
You'll also notice there's no Geysera match rate anywhere in this post. That is deliberate. We haven't run the audit above across enough customer traffic to publish a figure I'd still defend in a year, and until we have, quoting one would simply put us among the twelve. Ask us during a trial and we'll run the five steps with you, on your traffic, and you can keep the export.
We ended up recommending the self-audit because we ran it on ourselves and did not like the result. You build the thing, you see a number in your own dashboard, and it is real. You can point at the query that produced it. Then you run the same query against a different customer's traffic and it comes back several points lower, because their visitors skew more international, or more mobile, or they get a lot of agency traffic on shared IPs. Same product, same code, different answer. After that it got hard to argue that any single published number means much. So what we put on the site is the method rather than the percentage, and an offer to run it on your traffic during a trial. — Bob Thordarson, Geysera CEO
What a good answer from a vendor sounds like
Ask every vendor on your shortlist these six questions. In my experience the answers sort the category faster than any comparison table will.
- "Is that number person-level or company-level, and what happens if I ask for them separately?" A good vendor separates them without being pushed.
- "What is the denominator?" Unique visitors, sessions, US-only, or filtered to some qualified subset. All are legitimate. Not knowing, or not saying, isn't.
- "What share of my non-US traffic gets person-level resolution?" The accurate answer is usually "very little or none."
- "How fresh is the underlying graph, and how do you handle job changes?" This connects directly to your survival rate in Step 4.
- "Can I run my own audit during the trial and will you give me the raw export to do it?" This is the one that matters. A vendor confident in its data hands over the export.
- "What close rate does your ROI calculator assume?" I ask this one about the pitch, not the product. Every revenue projection here rests on an assumed close rate against an identified visitor, and almost nobody states it. Move it from one deal per 2,000 identified people to one per 500 and the same traffic projects four times the revenue.
A vendor who answers all six of those plainly is very probably quoting you a real number, even when it turns out to be smaller than you hoped for, because every one of the six costs them something: the split exposes how much is company-level, the denominator exposes how much traffic they excluded, and the survival question exposes how much of the remainder still works. A vendor who gets vague on the second and the fifth is quoting you a marketing number, and the size of it tells you nothing.
We go deeper on what person-level resolution can and can't deliver in Post 6, and on how the underlying graph produces these matches in Post 3. If you're still deciding whether the category is worth it at all, start with the pillar guide.
Frequently Asked Questions
What is a good match rate for website visitor identification?
For person-level identification on US traffic, the credible range is roughly 15-20%, with independent testing reporting 5-20% and one category glossary putting the best tools at 15-35%. Company-level identification is much higher, commonly 30-65%. Published vendor claims run as high as 55% at the person level and 80% at the company level. If you are quoted 40% or more at the person level, ask whether the figure combines person-level and company-level matches, and what denominator it uses.
Why do vendors publish such different match rates for the same tool?
Because there is no shared definition or published methodology. One product, RB2B, is currently listed at 40-45% by its own documentation, about 30% by one competitor, 10-20% by an independent tester, and 8-15% by another competitor. Each is measuring different traffic over a different window with a different definition of a match, and none of them show their work. The pattern holds across the category: every published table is lowest where the publisher has the least to gain.
Which visitor identification tool has the highest match rate?
By published claim, Happierleads at 30-55% person-level and 80%+ company-level, followed by Common Room with Vector at up to 50% person-level on US traffic, then RB2B at 40-45% and Bullseye at up to 40%. Those are the vendors' own figures, though, and independent testing across the category lands at 5-20% person-level. The highest published number and the best tool for your traffic are not the same question, which is why the self-audit below matters more than the ranking.
Is a 70-80% identification rate possible?
Only if it combines company-level and person-level identification. Roughly half of such a figure is typically "a company visited," which gives you an organization rather than a person you can contact. Person-level rates at that level are not supported by any independent testing we have found.
How do I verify a match rate on my own traffic?
Fix a 30-day window, use unique US visitors as your denominator, export the tool's identified people and dedupe them, then divide, keeping person-level and company-level separate. Finally, sample 100 identified contacts and check whether the email is deliverable and the person still holds that role. Multiply your match rate by that survival fraction to get a usable match rate.
Does a match rate stay accurate over time?
No. B2B contact data goes stale at somewhere between 22.5% and 30% a year, driven mainly by job changes, so a rate measured today overstates what the same tool delivers a year from now. This is why the sampling step matters more than the headline percentage.
Continue the Series
This is Post 4 in Geysera's 13-part series on B2B anonymous visitor identification.
- Post 1 — Anonymous website visitor identification: the complete 2026 guide (pillar)
- Post 2 — How to identify anonymous website visitors: 5 methods and what each delivers
- Post 3 — What is an identity graph? How visitor resolution actually works
- Post 6 — Person-level vs company-level identification
- Post 7 — The best website visitor identification tools (2026)
Sources
- RB2B — Contact-Level Identification (support documentation)
- RB2B — Company-Level Identification (support documentation)
- Bullseye — Bullseye vs RB2B comparison
- MarketBetter — 12 best B2B website visitor identification tools 2026, with tested match rates
- Warmly — Website visitor identification match rates: what every vendor won't tell you
- Happierleads — Visitor identification feature page
- Common Room — Enhanced website visitor identification (with Vector)
- Vector — Contact-level website identification
- Leadpipe — What is match rate in visitor identification?
- Factors.ai — Anonymous website visitor identification guide
- Instantly — Website visitor identification (TrafficID)
- Opensend — Best website visitor identification tools for ecommerce brands 2026
- TechCrunch — Cursor acquires Koala (July 2025)
- Twilio Segment — Identity resolution: what it is and how it works
- HubSpot — Database Decay Simulation (2.1%/month, 22.5%/year, per MarketingSherpa)
- ZoomInfo — How to improve B2B data quality (25-30% annual contact decay)
- Lead Forensics — trial-based evaluation position
- Unify — Website visitor identification: how it works and real match rates (Austin Hughes, Co-Founder and CEO; archived June 2026)

Co-Founder and CEO
Bob Thordarson is CEO and Co-Founder of Geysera, a serial entrepreneur with 25+ years and five co-founded ventures, including Cequint (acquired by TNS in 2010 for $112.5M) and Consumerware (acquired by ParkerVision). A graduate of the University of Washington and MIT Entrepreneurial Masters Program, based in Seattle, he serves on the boards of DRY Soda Co. and the Entrepreneurs' Organization Seattle chapter. He is an expert in retention marketing email systems and methodology for ecommerce and B2B brands — measured by incremental revenue, not vanity metrics.