Email Marketing Benchmarks 2026: Open Rates, CTR, and What They're Not Telling You
That 44% open rate? Nearly half of it is phantom data from Apple's privacy bots. We broke down 3.6M campaigns to expose which email metrics you can still trust — and what to measure instead in 2026. Real open rates, CTR, RPR, and deliverability data from 183,000+ brands. What the numbers actually mean vs. what platforms report.
Published: March 2026 | Reading time: 18 min | Last updated: March 16, 2026
What You Need to Know Before Reading Any Benchmark
- Open rates average 42-44% globally. Sounds great until you learn Apple Mail Privacy Protection inflates them by 15-20 points. Only 15% of marketers still treat open rates as a primary metric.
- Campaign CTR runs 1.69-2.09%. Flow CTR hits 5.58%. That 3x gap matters more than most people realize.
- Automated flows earn $1.94 per recipient. Campaigns earn $0.11. That's an 18x difference — from 2% of your total send volume.
- Abandoned cart flows convert at 10.7% with $3.65 RPR. The top 10% hit $28.89.
- Email still returns $36-$42 per dollar spent. But half of companies can't actually prove that because they don't measure ROI properly.
- 1 in 6 marketing emails never reaches the inbox. Gmail's inbox placement dropped to 53.7%.
- The distance between what platforms report and what's actually happening to your emails has never been larger.
The Baseline: Understanding Current Email Benchmarks
Let me be direct about something most benchmark reports won't say: the numbers you're about to read are compromised.
Not because the data sources are bad — Klaviyo tracks 183,000+ brands, MailerLite analyzed 3.6 million campaigns — but because the tracking infrastructure underneath these numbers has been systematically dismantled over the past four years.
Apple pre-loads your tracking pixels whether anyone reads the email or not. Gmail's security scanners click your links before a human ever sees them. Twenty U.S. states now restrict what you're allowed to track in the first place.
And yet. Email still generates higher ROI than any other marketing channel. The channel works fine. It's the ruler we've been measuring with that's broken.
So this guide does two things: gives you the actual benchmark numbers (because you need them), and tells you which ones you can trust, which ones are inflated, and what to measure instead. We pulled from Klaviyo, MailerLite, Omnisend, GetResponse, Litmus, and cross-referenced everything with insights from 25 of the top email marketing practitioners working today.
What Is a Good Email Open Rate in 2026?
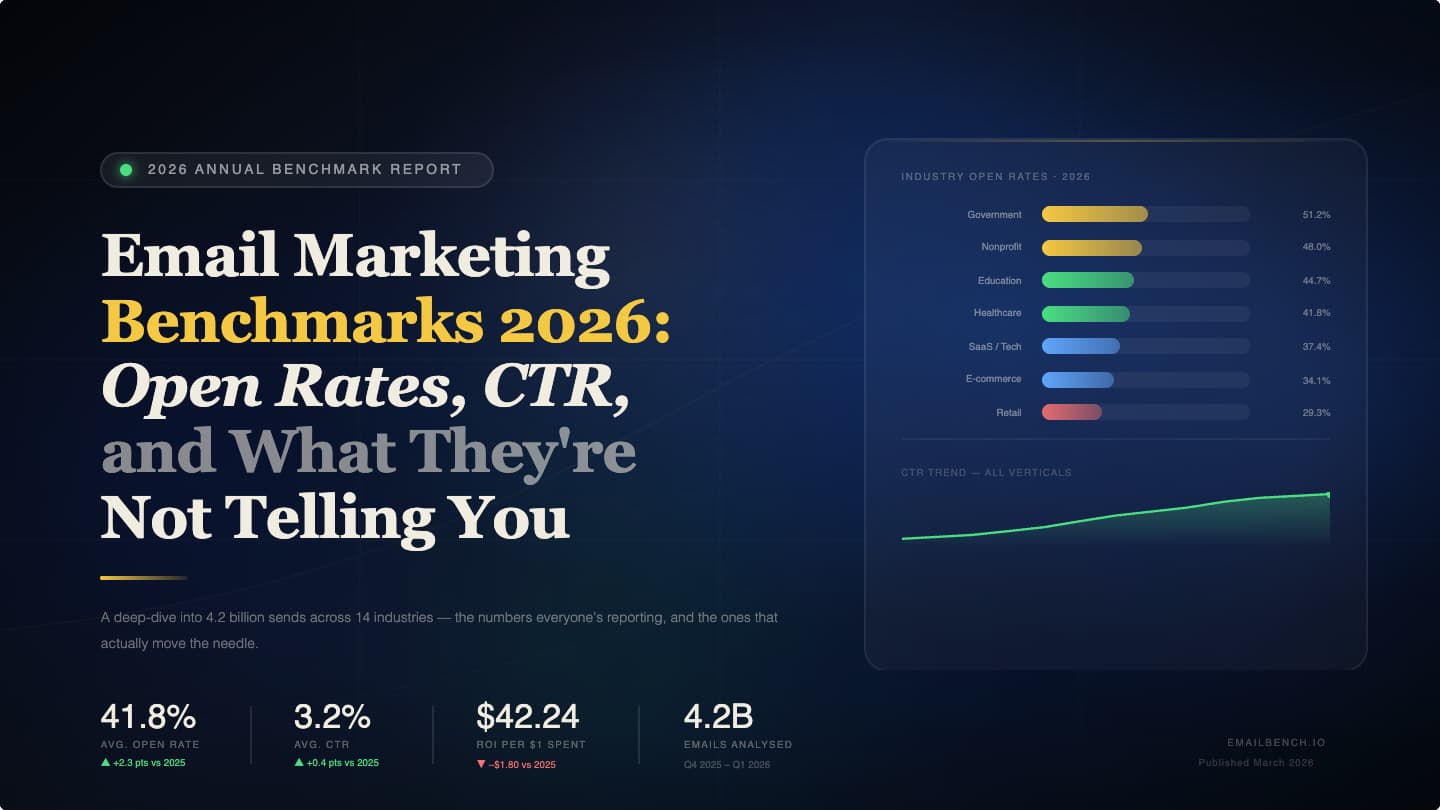
Somewhere between 42-44%, according to MailerLite's analysis of 3.6 million campaigns. Klaviyo puts the ecommerce average lower, at 31%, with the top 10% reaching 45.1%.
Both numbers are significantly higher than pre-2021 levels. This looks like progress. It isn't.
Apple Mail Privacy Protection is what happened. Since September 2021, Apple Mail has pre-loaded all email content — images, tracking pixels, everything — from proxy servers the moment an email arrives. Whether the subscriber reads it or not. Apple Mail now accounts for 49.29% of all email opens. About 64% of B2C subscribers use MPP-capable Apple Mail.
The practical result: campaigns that used to track 28% open rates now show 52%. Click rates and conversions didn't change. The "improvement" is phantom.
Where Open Rates Land by Industry
| Industry | Open Rate | What's Actually Going On |
|---|---|---|
| Religion | 55.71% | People who subscribe to church newsletters actually read them. Plus MPP. |
| Hobbies | 53.25% | Self-selected, passionate audiences |
| Non-profit | 52.38% | Mission alignment drives engagement |
| Art Gallery / Museum | 50.43% | Small, engaged lists |
| Government | 48.52% | Some of this is compliance — people have to read it |
| Health / Fitness | 47.81% | Personal relevance helps |
| E-commerce | 44.78% | Heavily inflated. Real engagement is lower. |
| Retail | 37.47% | Big lists, lots of volume, diminishing returns |
| Marketing / Advertising | 37.23% | We're all too jaded to open each other's emails |
| Travel / Transportation | 30.10% | Seasonal interest, high churn |
Source: MailerLite 2025-2026 Benchmark Report
What the People Who've Spent Decades on This Think
Chad White has been writing about email for 19 years. He's published nearly 4,000 articles on the subject across stints at Oracle, Litmus, Salesforce, and now Zeta Global where he's Group VP of CRM Strategy. His take is blunt: open rates are "health metrics, not success metrics." A sudden 10-point drop means you've got a deliverability problem. Beyond that, they can't tell you much anymore.
Jeanne Jennings runs the Email Optimization Shop and has been doing this for 20+ years. She still sees a narrow use for open rates — as an early warning system. But for A/B tests? Campaign comparisons? Engagement scoring? She considers those applications dead.
The numbers back them up. Only 15% of email marketers still lean on open rates as their primary success metric, according to Litmus.
What Is the Average Email Click-Through Rate in 2026?
CTR has inherited the throne by default. With opens corrupted, clicks are the first engagement signal that requires someone to do something on purpose. Twenty-nine percent of email professionals now call it their most important metric.
Campaign average: 2.09% (MailerLite) or 1.69% (Klaviyo, ecommerce-specific)
| Industry | CTR | Why It's High or Low |
|---|---|---|
| Legal | 4.90% | Contract updates and compliance deadlines demand action |
| Manufacturing | 4.22% | Spec sheets and quotes — you click or you miss the bid |
| Media | 4.10% | Curiosity-driven, content-rich |
| Construction | 3.53% | Project-related, time-sensitive |
| Hobbies | 3.30% | Passion makes people click |
| Non-profit | 2.90% | Donation CTAs work |
| E-commerce | 1.07% | People browse emails like catalogs. Looking isn't clicking. |
| Beauty / Personal Care | 0.95% | Same dynamic — visual consumption without action |
| Politics | 0.83% | People open out of outrage, then don't do anything |
Source: MailerLite 2025-2026
The Campaign vs. Flow Distinction (Don't Skip This Part)
This is where most benchmark reports mislead people. Campaign CTR and flow CTR are not the same thing, and lumping them together produces useless averages.
| Email Type | Below Average | Average | Good | Excellent |
|---|---|---|---|---|
| Broadcast campaigns | <1% | 1-2% | 2-4% | >4% |
| Automated flows | <3% | 3-5% | 5-8% | >8% |
| Welcome series | <4% | 4-7% | 7-12% | >12% |
| Abandoned cart | <5% | 5-8% | 8-15% | >15% |
| Win-back | <1% | 1-3% | 3-5% | >5% |
Flows outperform campaigns by about 3.3x on CTR. If you're comparing your abandoned cart flow to a campaign benchmark, you're comparing the wrong things entirely.
When CTR Is the Wrong Metric
Quick detour on something worth flagging: the rise of zero-click email content. Newsletters that deliver the full value inside the email — no click required — are seeing the highest subscriber retention and paid conversion rates.
Val Geisler has spent years consulting for brands like Stripe, Trello, and InVision on lifecycle marketing. She's been saying for a while that we should replace campaigns with conversations. If your newsletter is designed to be read in-inbox, measuring CTR on it makes about as much sense as measuring bounce rate on a page with no links.
For content-focused emails, consider reply rate, read time, and subscriber retention alongside clicks.
Click-to-Open Rate: Still Useful, With Caveats
CTOR measures what percentage of openers clicked: (Unique Clicks / Unique Opens) x 100. It's supposed to isolate content quality from deliverability.
Average: 6.81% in 2026, up from 5.63% in 2024 (MailerLite).
Top industries: Manufacturing (14.82%), Legal (14.72%), Media (12.92%). Bottom: Politics (2.96%), Insurance (3.19%), Beauty (3.91%).
The problem: CTOR's denominator is open count, and open counts are inflated by MPP. If Apple registers 1,000 "opens" when 600 people actually looked at your email, your CTOR is artificially deflated by 40%.
If your ESP offers MPP exclusion filters, turn them on before calculating CTOR. Use it to compare your own campaigns against each other, not against industry benchmarks that mix clean and polluted data.
Conversion Rates: The Numbers That Connect to Revenue
This is where the metrics start mattering financially.
By Email Type
| Email Type | Conversion Rate | Context |
|---|---|---|
| Abandoned cart | 10.7% | They were already buying. You just reminded them. |
| Post-purchase follow-up | 6.8% | Trust is established, barriers are low |
| Back-in-stock | 6.46% | They wanted it. Now it's available. Scarcity does the rest. |
| Welcome series | ~3% | First impressions, usually with a discount |
| Broadcast campaigns | 0.16% | A number that should make you question your campaign calendar |
That last number — 0.16% for campaigns vs. 2.11% for flows — is a 13x gap. Klaviyo's data across 183,000 brands confirms it. One in two people who click a welcome or abandoned cart email makes a purchase.
Click-to-conversion hit 9% overall in 2025, up 53% year-over-year. That's meaningful acceleration.
Chase Dimond has generated $200M+ in email-attributable revenue through his agency. His entire retention framework is organized around flow-level conversion: abandoned cart first, then browse abandonment, welcome, post-purchase, win-back. That's the build order. He doesn't start with campaigns.
Revenue Per Email: What Should Actually Be on Your Dashboard
If you replace one metric in your reporting this year, make it this one.
Revenue Per Recipient (RPR) = Total Revenue / Unique Recipients
Campaign RPR (Klaviyo 2026, 183,000+ brands)
| Sector | Average RPR | Top 10% RPR |
|---|---|---|
| Overall | $0.11 | $0.97 |
| Food / Beverage | $0.16 | — |
| Automotive | $0.16 | — |
| Clothing / Accessories | $0.12 | — |
Flow RPR
| Flow Type | Average RPR | Top 10% RPR |
|---|---|---|
| All Flows | $1.94 | $16.96 |
| Abandoned Cart | $3.65 | $28.89 |
| Welcome Series | $2.65 | $21.18 |
| Browse Abandonment | $1.50 | $12.30 |
The gap: 17.6x. Flows produce nearly eighteen times more revenue per person reached.
Jeanne Jennings uses a variation for larger programs — RPME (Revenue Per 1,000 Emails Delivered) — because per-email numbers like $0.003 don't land psychologically. Her best case study: Scholastic cut send volume by 10% per quarter while tightening their targeting. They went from emailing once daily to twice weekly. The result was a 150% increase in quarterly RPME. They sent fewer emails. Each one made more money.
That result is a direct rebuttal to every email program built on "more sends = more revenue." It's also the kind of finding that makes people uncomfortable, because it means volume-chasers might be actively destroying their own economics.
The ROI Numbers
| Benchmark | ROI |
|---|---|
| Industry average | $36-$42 per $1 spent |
| Retail/ecommerce | Up to $45 per $1 |
| US merchants (Omnisend) | $76 per $1 |
| Regular A/B testers | $42 per $1 |
| Non-testers | $23 per $1 |
Companies that A/B test regularly see 83% higher ROI. That is maybe the single most actionable stat in this entire guide. And yet only 12% of marketers put more than 15% of their budget toward email. The channel with the highest return gets among the lowest investment. Go figure.
The Phantom Engagement Problem
Here's what no platform benchmark report is going to volunteer: a chunk of your "engagement" is not human.
Dark opens: Apple pre-loads your tracking pixels. Gmail pre-fetches images. Open rates are inflated 15-20 points in Apple-heavy audiences. Up to 75% of reported opens in some segments are fake.
Dark clicks: Gmail's "click-time link protections," Outlook Safe Links, and Yahoo's security scanners all pre-click your links to check for malware. Your CTR is inflated. Your engagement scores are wrong. Your A/B tests may be choosing the variant bots prefer.
AI bot crawling: In early 2025, ChatGPT and ClaudeBot user agents started showing up in email click logs. By March, monitored platforms were seeing over 3 million bot clicks per day.
This isn't just an analytics nuisance. Bots trigger your automated flows. They click unsubscribe links, removing real subscribers. They click confirmation links, validating fake signups. They make your A/B test results unreliable.
How Good Teams Are Dealing With It
- Time-to-action filters: Anything under one second is almost certainly a machine
- Hidden link honeypots: Invisible links that only bots would click. If something clicks a white-on-white link, you know it's not human.
- ESP bot filtering: Most major ESPs started filtering known bot clicks in late 2025
- Code-based confirmation: Numerical codes instead of click-to-confirm for opt-ins
- HTTPS everywhere: HTTP links get pre-scanned more aggressively
If you haven't audited your metrics for bot activity, the gap between reported and real CTR could be anywhere from 20-50%.
Deliverability: Where Everything Else Falls Apart
Nobody wants to talk about deliverability because it's not glamorous. But if your emails aren't arriving, your subject line tests are meaningless.
| Metric | Where It Stands |
|---|---|
| Server delivery rate | 98.16% |
| Actual inbox placement | 83-85% |
| Gmail inbox placement | 53.70% (down from 58.72%) |
| Corporate email inbox placement | <51% |
| DMARC adoption (top 10M domains) | 18.2% |
That 83-85% inbox placement number means about 1 in 6 of your emails never reaches anyone's inbox. For Gmail specifically, nearly half of marketing emails miss.
Gmail changed the rules in September 2025: Promotions tab emails are now sorted by relevance, not recency. If your subscribers don't engage with you regularly, you get buried under brands they do engage with — regardless of when you sent.
The authentication requirements are straightforward: SPF, DKIM, DMARC, one-click unsubscribe, and keep spam complaints under 0.3% (targeting under 0.10%). But only 18.2% of top domains even have valid DMARC. Most senders are structurally set up to fail before they write a single subject line.
Israa A. at 360Inbox has driven $120M+ in impact revenue, largely through deliverability work. Her consistent finding: fixing authentication and sender reputation produces more incremental revenue than any creative optimization. Get found before you get fancy.
Bounce Rates and Unsubscribe Rates: The Maintenance Metrics
These aren't exciting. They're essential.
Bounce targets: Hard bounces below 0.5%. Soft bounces below 1.5%. Total below 2%. Email lists decay at roughly 22.5% per year — you're on a treadmill just to stay level.
Unsubscribe rates: The median is 0.22%, up from 0.08% in 2024. Below 0.5% is healthy.
But standard unsubscribe rates can hide serious problems. That's why Jennings developed two ratio metrics that are spreading through the industry:
Unsubscribe-to-Click Rate: Unsubscribes divided by unique clicks, times 100. Keep it below 50%. One of her clients had a 0.5% unsubscribe rate — perfectly normal by industry standards. But their unsubscribe-to-click ratio was 200-400%. For every person engaging with the content, three people were bailing on the list entirely. The standard metric said "fine." The ratio metric said "emergency."
Spam-Complaint-to-Click Rate: Same idea — complaints divided by unique clicks, times 100. Keep it below 10%.
When you normalize complaints and unsubs against the people who actually engaged, you see the real content quality picture. Absolute rates denominated against your entire list mask everything.
Flows vs. Campaigns: The 18x Revenue Gap
If you only internalize one section of this guide, make it this one.
| Metric | Campaigns | Automated Flows | How Much Better |
|---|---|---|---|
| Open Rate | 31% | 38-42% | 1.3x |
| Click Rate | 1.69% | 5.58% | 3.3x |
| Placed Order Rate | 0.16% | 2.11% | 13.2x |
| RPR | $0.11 | $1.94 | 17.6x |
| Top 10% RPR | $0.97 | $16.96 | 17.5x |
Flows produce 37% of email revenue from 2% of sends. One in two people who click a welcome or abandoned cart email makes a purchase. Birthday emails drive $744.37 average order value — four times normal.
Austin Brawner built Brand Growth Experts around a simple thesis: build your automation architecture before spending significant time on campaigns. A well-constructed flow system earns money while you sleep. Campaigns require perpetual creative production.
Andriy Boychuk runs Flowium, a Klaviyo Elite agency. He reports that his clients typically go from 10% to 30%+ of email revenue coming from flows within 90 days of proper setup.
Most email teams spend 80% of their time on campaigns and 20% on automation. The data says that ratio should be closer to inverted.
SMS vs. Email: Different Tools, Same Goal
Quick comparison because everyone asks:
| Metric | SMS | |
|---|---|---|
| Open rate | 90-98% | 28-39% |
| CTR | 6-35% | 2-3.8% |
| Conversion | 21-30% | 12-15% |
| ROI | $21-71 per $1 | $36-42 per $1 |
| Unsubscribe rate | 1.5-3.5% | 0.08-0.22% |
SMS dominates raw engagement. Email dominates ROI consistency and subscriber retention — unsub rates are 10-15x lower on email.
Consumer tolerance matters here: 49% of subscribers are comfortable with one text per week. 53% unsubscribe if they feel over-texted. Email subscribers tolerate far more frequency.
Jimmy Kim built Sendlane specifically around the idea that these channels work together, not against each other. Brands using both see about 30% higher CLV than those using one.
SMS is a scalpel — flash sales, shipping alerts, back-in-stock. Email is the Swiss army knife — education, storytelling, complex nurture sequences. The mistake is treating them as interchangeable.
What AI Is Doing to Every Metric
Seventy percent of US marketers use generative AI tools. Thirty-four percent use it for email copy specifically.
The measurable impact:
| Application | What It Does |
|---|---|
| Subject line optimization | +22% open rates |
| Send-time optimization | +15-23% open rates |
| 1:1 personalization | +82% conversion rates |
| Overall AI-powered campaigns | +41% revenue vs. traditional |
The production speed shift is dramatic: only 6% of teams need 2+ weeks to produce an email. In 2024, that number was 62%.
Jay Schwedelson runs SubjectLine.com and has analyzed data from 6+ billion emails. His findings on AI-optimized subject lines: priority alerts lift open rates 28%. Three-words-or-less subject lines with no preheader push opens up 25%. Downplayed urgency — counterintuitively — lifts rates 20%+.
The risk nobody's talking about enough: AI inbox gatekeepers. Google's CC agent and ChatGPT's Pulse now summarize email content before recipients see it. If an AI agent decides your email isn't worth surfacing, your subject line optimization becomes irrelevant. The winning factor shifts to sender reputation and relationship quality — things you can't A/B test in a week.
Jennings' warning on this: "Marketers who treat AI as a means to deepen relevance, not a shortcut around fundamentals, will outperform." When everyone's using the same AI to write subject lines, nobody has an AI advantage anymore. You're back to competing on brand, strategy, and genuine subscriber relationships.
Send Times: What the Data Shows (And What It Doesn't)
| Day | Open Rate | Click Rate |
|---|---|---|
| Friday | 49.72% | 8.09% |
| Tuesday | 49.30% | 7.84% |
| Wednesday | 48.90% | 7.60% |
| Monday | 49.44% | 7.20% |
Best windows: 8-11 AM for opens, 3-4 PM for clicks, 8-9 PM for conversions. One surprising data point: 8 PM showed a 59% open rate in 2025 data — highest of any time slot.
I'll be honest: the differences between Tuesday, Wednesday, and Thursday are within noise range. Anyone selling you on Tuesday at 10:03 AM being definitively better than Wednesday at 10:03 AM is selling false precision. Use AI send-time optimization (15-23% lift) or just test with your own audience. The "best" time is when your subscribers act, not when an aggregate says they should.
The Attribution Problem
This section makes email agencies uncomfortable. Good.
Brands waste about $66 billion annually on broken attribution. Half of CTOs don't trust their marketing platform data. Half of companies can't properly measure email ROI. Those numbers aren't from pessimists — they're from the platforms themselves.
The core issue: last-click attribution gives email 100% credit when the actual journey was Instagram ad → blog post → retargeting → cart abandonment → email reminder → purchase. The email was the last touch, but it wasn't the whole story.
Alex Greifeld writes the "No Best Practices" newsletter and has been operating in ecommerce since 2011. She's been pointing out for years that email platforms and loyalty software have a structural incentive to claim maximum attribution — because that's how they justify their subscription cost. When Klaviyo says a flow "generated" $50,000, how much was genuinely incremental?
Danavir Sarria has been doing email marketing since he was 16 — over 12 years now. He runs The Upsell and argues that most agencies report inflated ROI because they pick whichever attribution model makes email look best.
The fix is incrementality testing: hold back 5-10% of qualified recipients from receiving an email and measure the purchase rate difference. That delta is your true incremental impact. Companies doing this report 15-30% improvement in marketing efficiency — not because their emails perform better, but because they stop wasting budget on non-incremental sends.
Seventy-three percent of companies over $250M now use multi-touch attribution. Marketing Mix Modeling is emerging as a privacy-safe alternative. The direction is clear. The question is whether your team gets there before your competitors do.
Privacy and Regulation: The Tracking Signal Is Shrinking
GDPR now requires explicit consent for individual open tracking (CNIL 2025 draft). Fines hit 1.2 billion euros in 2024. Twenty US states enforce comprehensive privacy laws. Eight mandate Global Privacy Control recognition.
Every one of these changes reduces what you can track: opens (compromised by MPP + consent requirements), clicks (bots + scanners), location (proxies), device data (anonymization), cross-device identity (85%+ ATT opt-out).
Individual-level email tracking is ending. What's replacing it: aggregate measurement, cohort analysis, first-party data, and direct response signals like purchases and replies.
Regulators are also going after dark patterns in consent flows. Pre-checked boxes, countdown timers, obfuscated opt-outs, and easier-accept-than-reject paths all violate current rules and can invalidate consent retroactively.
A Metrics Framework That Actually Works in 2026
Based on what we've seen from the practitioners who are getting results — not the ones selling benchmarks — here's how to organize your measurement:
Tier 1: Revenue (Look at These Weekly)
| Metric | Target |
|---|---|
| Revenue Per Recipient | Campaigns: >$0.11; Flows: >$1.94 |
| Flow-Level Conversion Rate | Abandoned cart: >10%; Welcome: >3% |
| Customer Lifetime Value | CLV:CAC ratio above 3:1 |
| Incremental Revenue | Requires holdout testing |
Tier 2: Engagement (Also Weekly)
| Metric | Target |
|---|---|
| Click-Through Rate | Campaigns: >2%; Flows: >5% |
| Click-to-Conversion Rate | >9% |
| Unsubscribe-to-Click Rate | <50% |
| Spam-Complaint-to-Click Rate | <10% |
Tier 3: Health (Monthly)
| Metric | Target |
|---|---|
| Inbox Placement Rate | >85% |
| Bounce Rate | <2% total |
| List Growth Rate | 1-3%/month |
| Open Rate (MPP-filtered) | Track the trend, ignore the number |
Tier 4: Strategic (Quarterly)
| Metric | Target |
|---|---|
| Email Revenue as % of Total | 20-30% for ecommerce |
| Automation Revenue as % of Email | >30% |
| Cohort Retention Curves | Should not be declining |
| RPME Trend | Should be increasing QoQ |
One thing I'd add: cohort analysis matters more than campaign analysis. Your aggregate retention might look stable while your most recent signup cohort churns at double the rate. Track acquisition cohorts (by signup date) and behavioral cohorts (by actions taken) to catch problems that averages hide.
Quick Reference: 2026 Industry Benchmarks
Campaigns by Industry (MailerLite)
| Industry | Open Rate | CTR | CTOR | Unsub |
|---|---|---|---|---|
| Religion | 55.71% | 2.95% | — | 0.13% |
| Hobbies | 53.25% | 3.30% | 8.45% | 0.24% |
| Non-profit | 52.38% | 2.90% | 8.24% | 0.18% |
| Government | 48.52% | 3.05% | 8.44% | — |
| E-commerce | 44.78% | 1.07% | 4.01% | — |
| Manufacturing | 37.36% | 4.22% | 14.82% | 0.30% |
| Travel | 30.10% | — | — | 0.13% |
Ecommerce Flows (Klaviyo)
| Metric | Average | Top 10% |
|---|---|---|
| Campaign RPR | $0.11 | $0.97 |
| Flow RPR | $1.94 | $16.96 |
| Abandoned Cart RPR | $3.65 | $28.89 |
| Welcome Flow RPR | $2.65 | $21.18 |
By Region
| Region | Open Rate | CTR |
|---|---|---|
| Oceania | 46.34% | 2.35% |
| Europe | 41.20% | 2.10% |
| North America | 39.80% | 1.95% |
| Asia-Pacific | 19.14% | 1.09% |
Mobile vs. Desktop
Mobile takes 47-60% of opens. Desktop takes the conversions. Gen Z (67%) and Millennials (59%) are smartphone-primary for email. Desktop users read longer (13.2 sec vs. 9.7 sec) and click more (3.4% vs. 2.6% CTR).
93% of marketing emails are mobile-optimized. Responsive design lifts clicks 15%. Design for mobile, but don't forget that the buying often happens on a laptop.
What the Experts See Coming
Chad White (Zeta Global) — As AI intermediaries stand between brands and inboxes, sender reputation and relationship quality will replace surface-level engagement metrics as the things that actually determine results.
Jeanne Jennings (Email Optimization Shop) — The role evolves from campaign executor to Lifecycle Architect. First-party data is the most strategic asset in 2026. Welcome series — not abandoned cart — may be the most undervalued flow.
Jay Schwedelson (SubjectLine.com) — Counterintuitive approaches beat "best practices" at scale. The future is hyper-contextual benchmarking. What works for a flash sale destroys a nurture sequence.
Alex Greifeld (No Best Practices) — "The most important metric is one most brands don't track: what percentage of email revenue is truly incremental?" Real retention improvements come from product quality, not clever flows.
Val Geisler (Fix My Churn) — Relationship quality over engagement quantity. Optimize for customer value over send volume. The best email programs treat subscribers as people to understand, not segments to blast.
Chase Dimond (Structured Agency) — Retention strategy should be structured around flow-level conversion. The 90-day automation build order matters more than any individual subject line.
Frequently Asked Questions
What is a good email open rate in 2026? The global average is 42-44%, but Apple MPP inflates that by 15-20 points. The "real" engagement rate for most industries is closer to 25-30%. But the better question is: why are you still using open rates? Only 15% of marketers do. Focus on CTR and RPR instead.
What is the average email click-through rate in 2026? Campaign CTR averages 1.69-2.09%. Flow CTR averages 5.58%. A good campaign CTR is above 2%; a good flow CTR is above 5%. Top performers hit 4%+ on campaigns and 10%+ on flows. Always compare against the right email type — flows and campaigns are different animals.
What is the ROI of email marketing in 2026? $36-$42 per dollar on average. Companies that A/B test see $42 (83% more than non-testers at $23). Some US merchants hit $76 per dollar. But about half of companies can't actually prove their email ROI because they don't measure it properly.
Are email open rates still reliable? No. Apple Mail (49% of opens) pre-loads tracking pixels regardless of engagement. Only 15% of marketers still treat them as a primary metric. Use them for deliverability trend monitoring — a sudden drop means something is wrong — and nothing else.
How much more revenue do automated flows generate than campaigns? 18x more per recipient ($1.94 vs. $0.11). 13x higher conversion (2.11% vs. 0.16%). And they do it from 2% of total send volume while generating 37% of email revenue.
What percentage of marketing emails actually reach the inbox? About 83-85% on average. For Gmail specifically, 53.7%. Full authentication (SPF, DKIM, DMARC) and a spam complaint rate under 0.10% are table stakes.
How do bot clicks affect my email data? Gmail, Outlook, and Yahoo all pre-click links for security scanning. AI bots generated 3+ million clicks per day at peak. The gap between reported and real CTR can be 20-50%. Bots also trigger your automations, corrupt A/B tests, and click unsubscribe links.
Where This Leaves Us
Six things the data says when you strip away the noise:
Open rates are busted. Monitor them for deliverability problems. Stop using them for anything else.
CTR is the best engagement metric available — but it's not clean either, thanks to bot clicks. And for content-focused emails, it may not be the right metric at all.
Revenue Per Recipient belongs on every dashboard. It shows you the 18x gap between flows and campaigns that open rates and CTR can't reveal.
Automation is dramatically underinvested. Thirty-seven percent of revenue from 2% of sends. The ROI math demands more resources here.
Your reported benchmarks are inflated. MPP, bots, and last-click attribution all push numbers up. Incrementality testing and Jennings' ratio metrics give you a truer picture.
Deliverability is the foundation. If 1 in 6 emails doesn't arrive, nothing else you do matters.
Email is still the best-returning channel in marketing. But only if you measure it honestly and put your effort where the data points — which is overwhelmingly toward automated flows, deliverability fundamentals, and genuine subscriber relationships rather than campaign volume and open rate vanity.
Sources and Methodology
Platform Benchmark Reports: Klaviyo 2026 (183,000+ brands) | MailerLite 2025-2026 (3.6M campaigns, 181,000+ accounts) | Omnisend 2025-2026 | GetResponse | Mailchimp | Campaign Monitor | Litmus 2025-2026 | Validity 2026 Deliverability Report | DotDigital 2026
Industry Research: HubSpot Email Marketing Statistics 2026 | Designmodo Email Marketing ROI | Robly Email Marketing Statistics 2026
Expert Sources: Chad White (emailmarketingrules.com) | Jeanne Jennings (emailopshop.com) | Jay Schwedelson (SubjectLine.com) | Chase Dimond (chasedimond.com) | Alex Greifeld (nobestpractices.co) | Val Geisler (valgeisler.com) | Austin Brawner (austinbrawner.com) | Andriy Boychuk (flowium.com) | Jimmy Kim (sendlane.com) | Israa A. (360inbox.com) | Danavir Sarria (theupsell.co)
Regulatory: CNIL 2025 Draft Recommendations | SecurePrivacy GDPR Compliance 2026 | OneTrust Privacy Trends 2026
Maintained by Geysera. Updated as new benchmark data becomes available.